Spatial Data Explorer
Urban planners read a city in layers: land use, road density, income, all fighting for the same pixels on a flat screen. We built a Meta Quest app that pulls the layers apart in 3D, with the controls in your hands.
Role: Lead VR developer & UX
Shipped
a working Meta Quest build with a hand-tracked layer system.
Private Meta Quest build. Live walkthrough on request.
- Year
- 2025
- Course
- CMPT 496 Capstone, MacEwan
- Team
- With Keegan Vanstone
- Scope
- Meta Quest app, hand-tracked UI, data pipeline
- Stack
-
- Engine
-
- Unity
- Language
-
- C#
- Geospatial
-
- ArcGIS Maps SDK
- XR
-
- Meta XR
- hand tracking
- Platform
-
- Meta Quest
- Infra
-
- Unity DevOps
Overview
A capstone project (CMPT 496), built with one teammate over a single term. The brief: give urban planners and analysts a way to explore layered geospatial data in three dimensions instead of flattened on a screen. We shipped a working Meta Quest build driven by real datasets and hand tracking.
My role
As lead developer and interaction designer, I built the Unity prototype and shaped the interface: the hand-tracked interactions, the layer system, and the ArcGIS Maps SDK integration that streams real geospatial data and moves cleanly between cities. This case study follows that build, from the ArcGIS data path to the runtime layer control on top of it.
With Keegan Vanstone
The problem
Spatial data, trapped on flat screens
Geospatial work means parsing dense, layered information in tools built for 2D or 3D viewing. They are powerful, but they are demanding, and answering a simple question can mean reaching for several at once. For planners and analysts, reading spatial relationships across disconnected maps and dashboards is slow, and it can hide the insight entirely.
- 01
Flat screens flatten space
Map and dashboard tools force complex geospatial data onto 2D screens, draining the depth perception and spatial reasoning the work depends on.
- 02
One task, many tools
Analysts hop between apps and browser tabs to reach different datasets, and the analysis fragments across all of them.
- 03
Layers without a shared context
Zoning, demographics, infrastructure: planners and policymakers get the most from these when they sit in one shared 3D space, not separate windows.
- 04
Immersive tech left on the table
VR has been explored elsewhere, but rarely pointed at geospatial datasets specifically. That gap is the opening.
The solution
The VR answer, in three moves
Step inside the map
A 3D environment with hand-based navigation, so spatial data is explored, not just viewed.
Placing planners directly inside a 3D map draws on spatial and kinesthetic learning, making complex relationships easier to read than a flat screen allows.
The Problem It Answers
Flat screens drain the depth perception the work depends on, and VR had rarely been aimed at geospatial data. Standing inside the map answers both.
Layers in your hands
Toggle visibility, dial opacity, and read a live legend from an in-world panel.
An in-world UI panel toggles layer visibility, adjusts opacity, and enables or disables overlays, all reachable by hand inside the headset.
The Problem It Answers
Analysts used to hop between apps and tabs to reach each dataset. An in-world panel puts every layer in one pair of hands.
Real ArcGIS data
The ArcGIS Maps SDK brings high-accuracy geography into the scene.
Real datasets stream through the ArcGIS Maps SDK, so stakeholders analyze accurate, real-world geography in an interactive context.
The Problem It Answers
Layers mean little read in isolation. Streaming real ArcGIS data sets them in one shared, accurate 3D context.
Research
Designing for one analyst in particular
My teammate and I reviewed prior work and defined user needs through a persona, to pin down exactly where traditional spatial tools fall short, and where an immersive one could do better.
User statement
As an urban planner, I want to intuitively explore layered geospatial data in a virtual environment to quickly understand spatial relationships and make informed planning decisions.
Persona

Maya Rodriguez, 35
Municipal GIS Analyst · Vancouver, BC · Meta Quest 3
I need to see how all the layers interact, elevation, zoning, infrastructure, without flipping between ten different maps.
Goals
- Evaluate potential development zones with complete spatial context.
- Compare zoning boundaries and building footprints in a single environment.
- Communicate spatial insights clearly to non-technical stakeholders.
Pain points
- Wastes time toggling between flat maps and layers in disconnected tools.
- Struggles to convey spatial relationships to decision-makers using 2D diagrams.
- Finds it hard to explain spatial decisions to teammates without visual aids.
Design
Turning spatial data into something you reach into
With the research and our technical constraints in hand, I led the ideation and interface design, translating data interactions into a flow that would feel natural to VR newcomers and veterans alike.
UI flow
The first run
Walk the onboarding, step by step
Idea exploration
Wireframing
Data pipeline
Streaming real cities into Unity
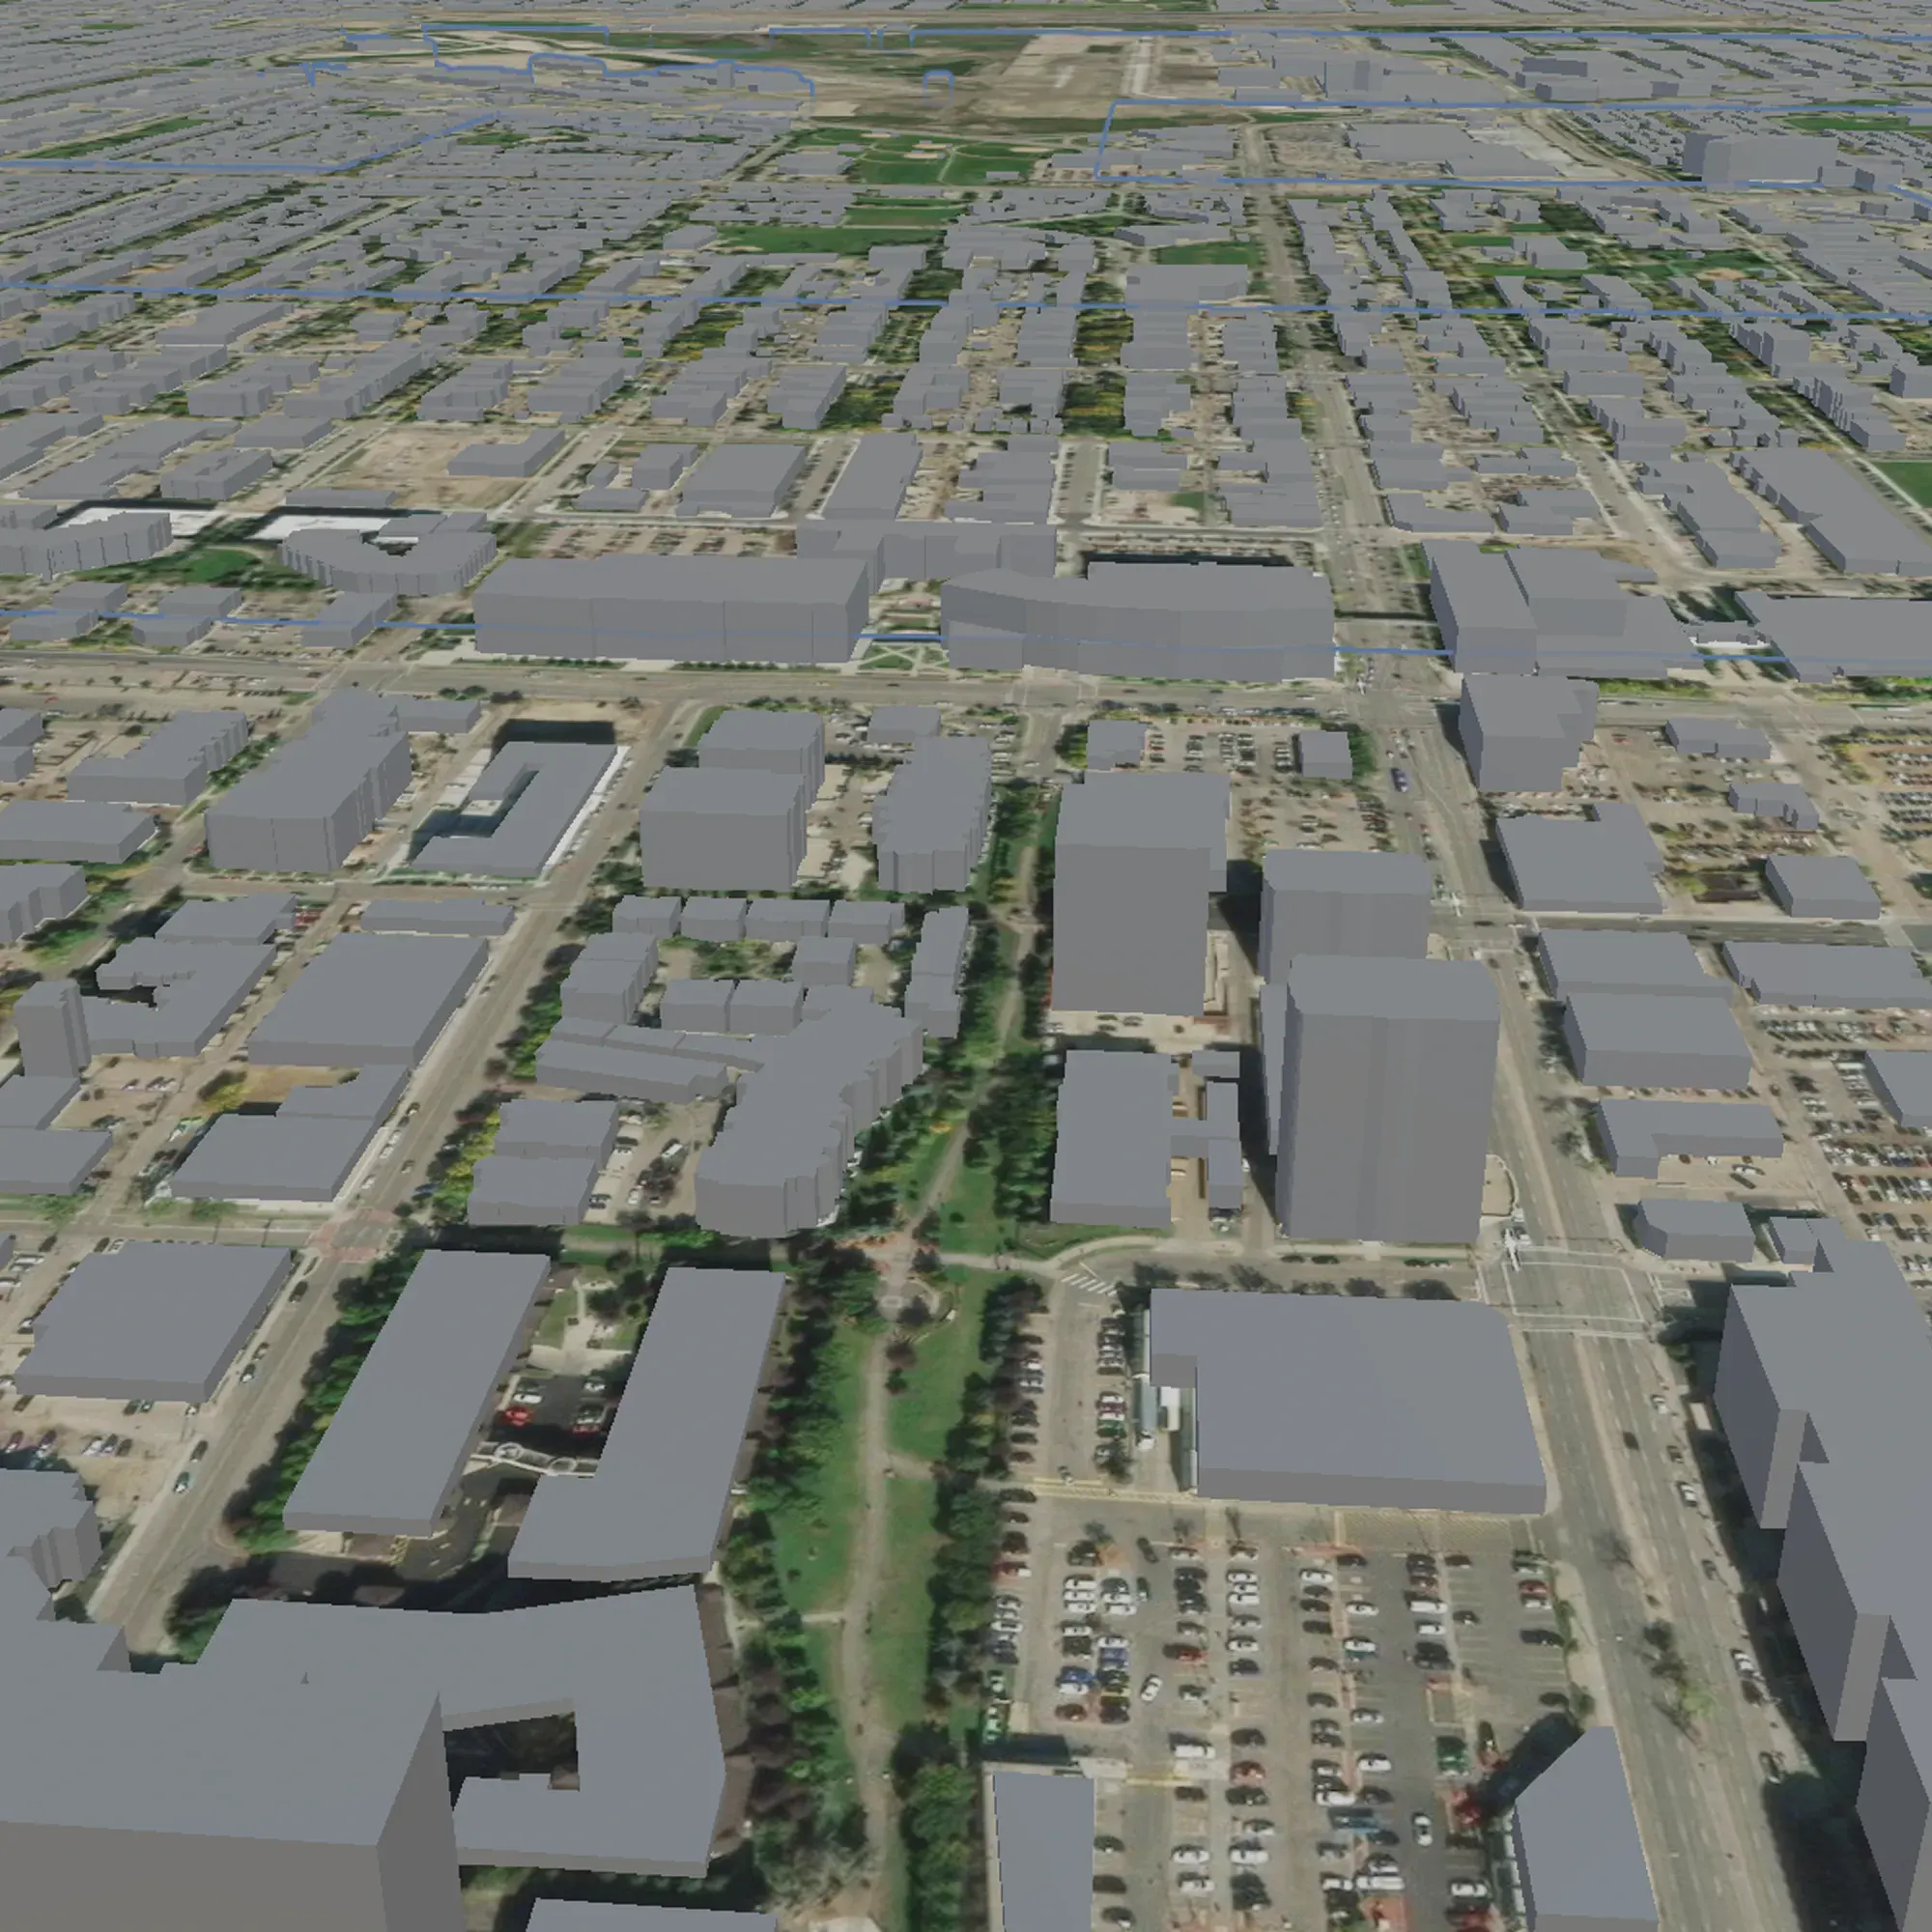
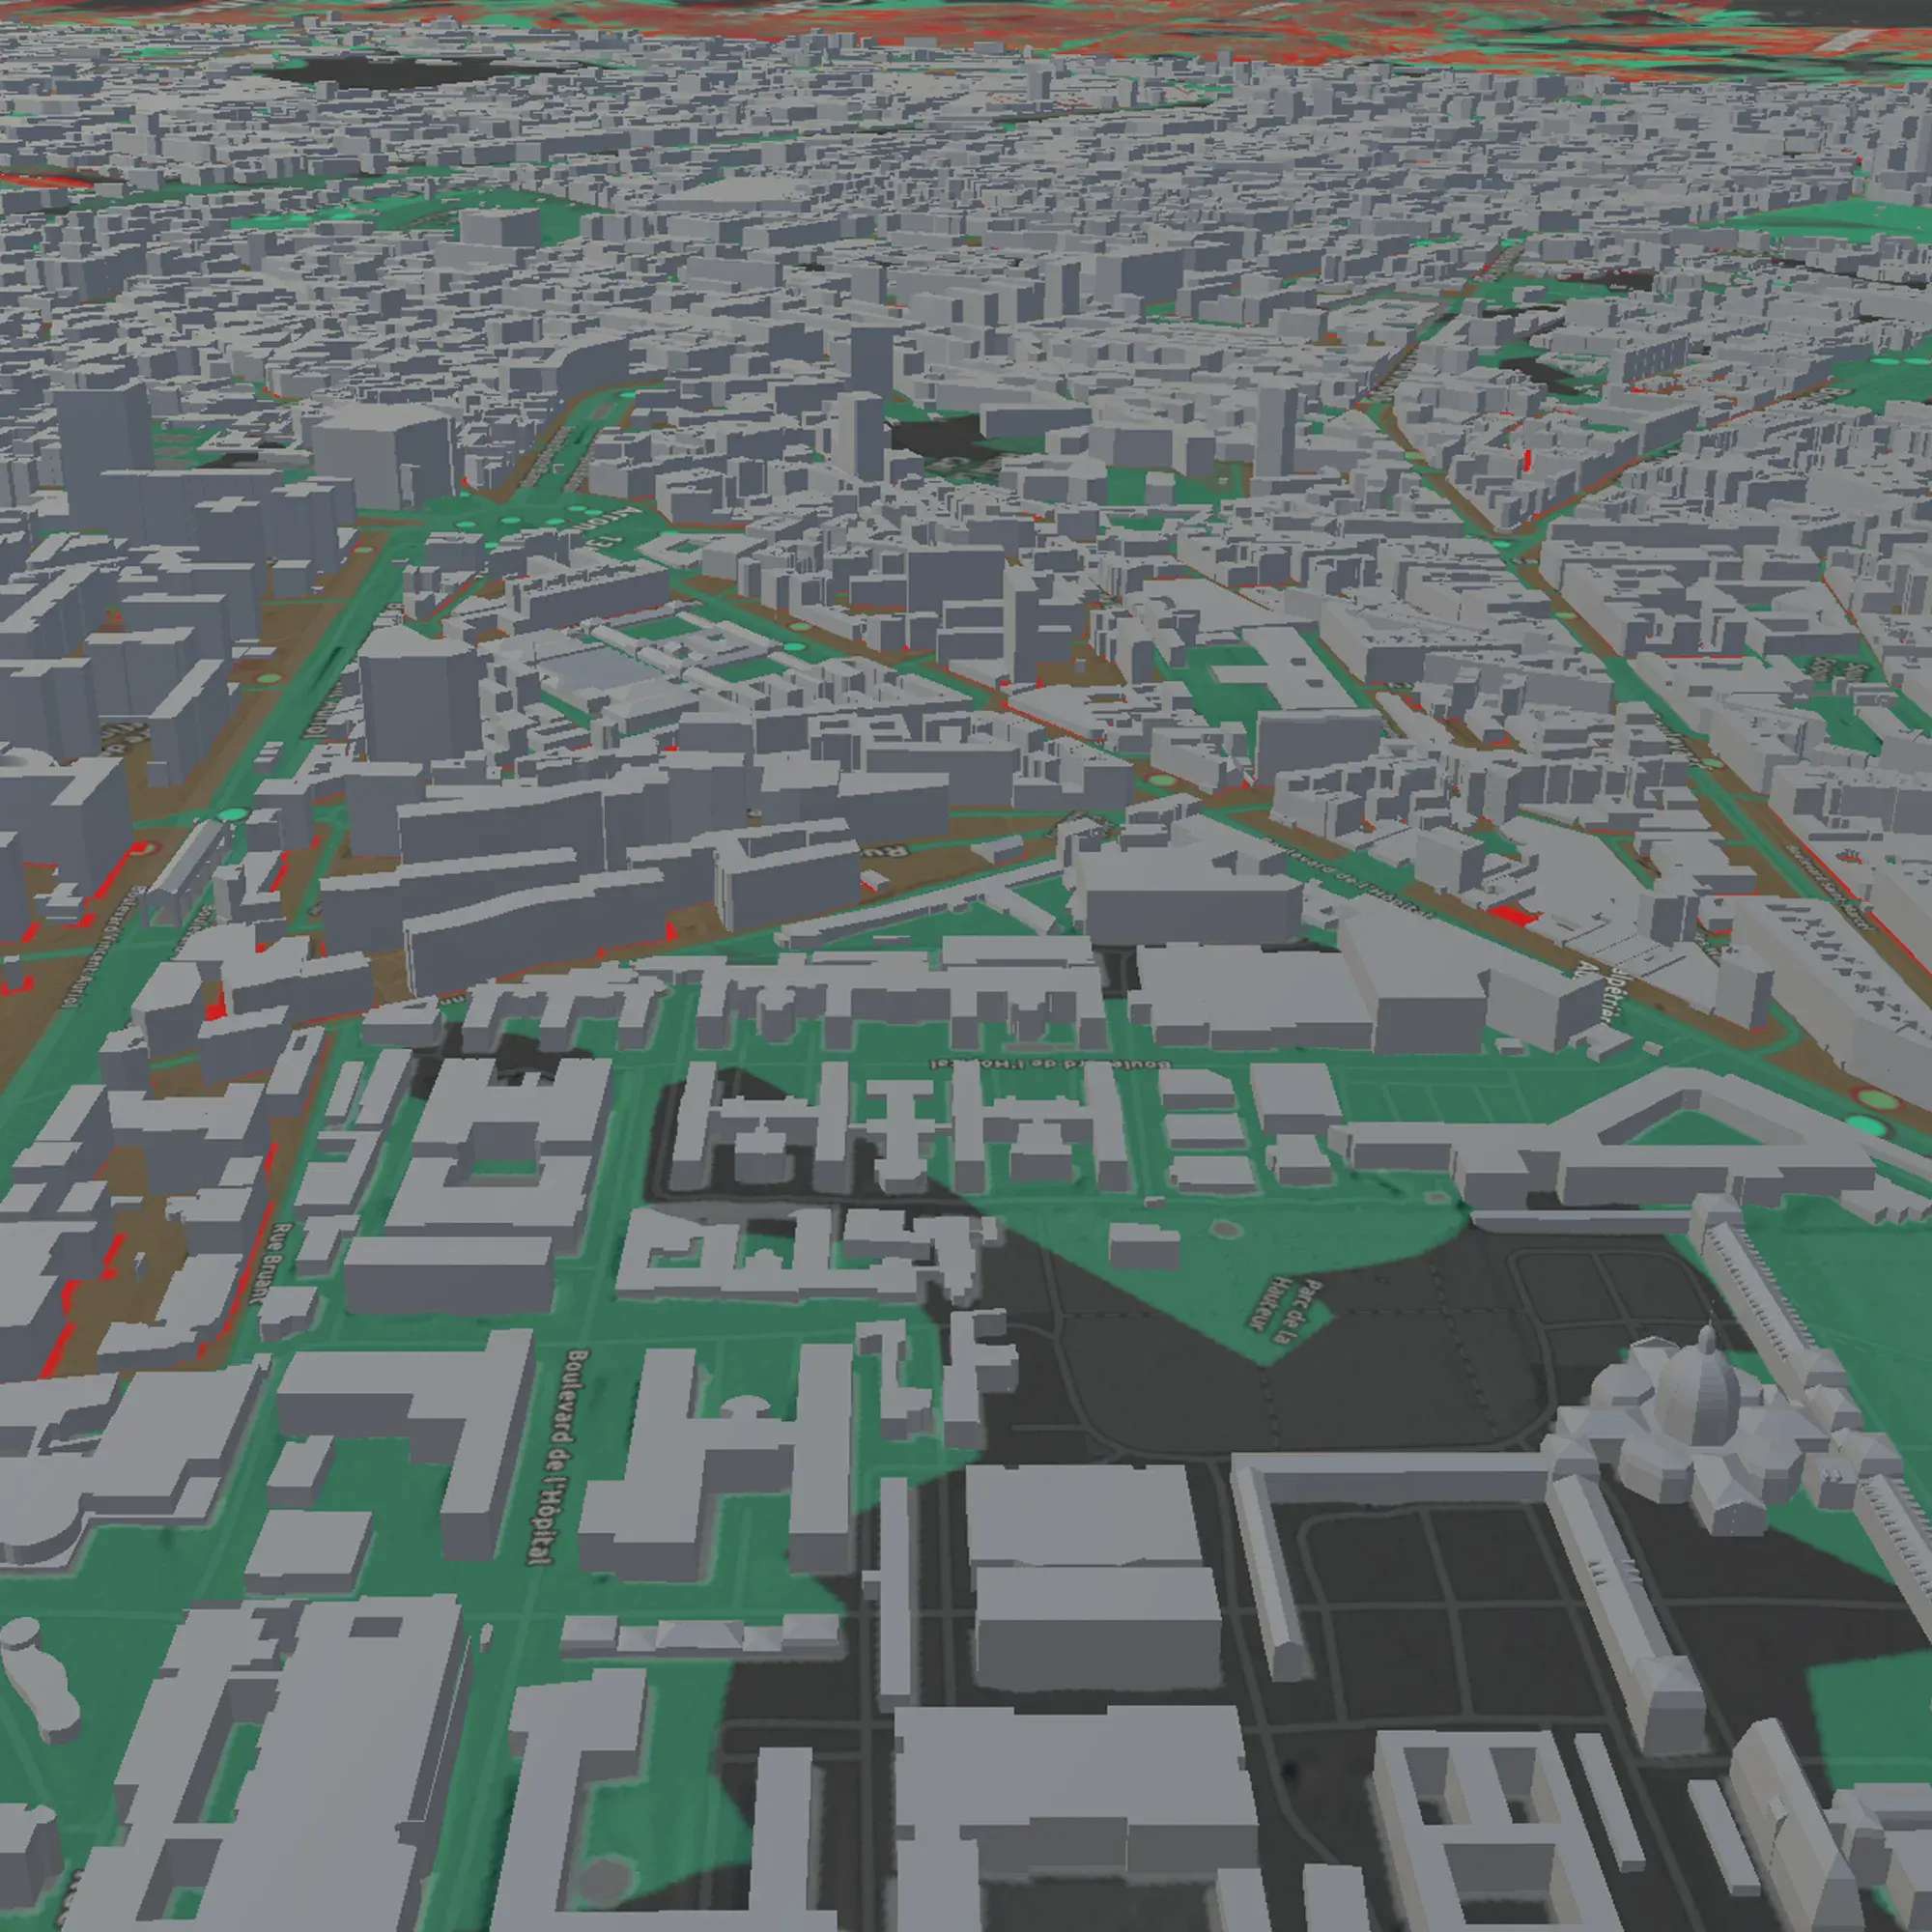
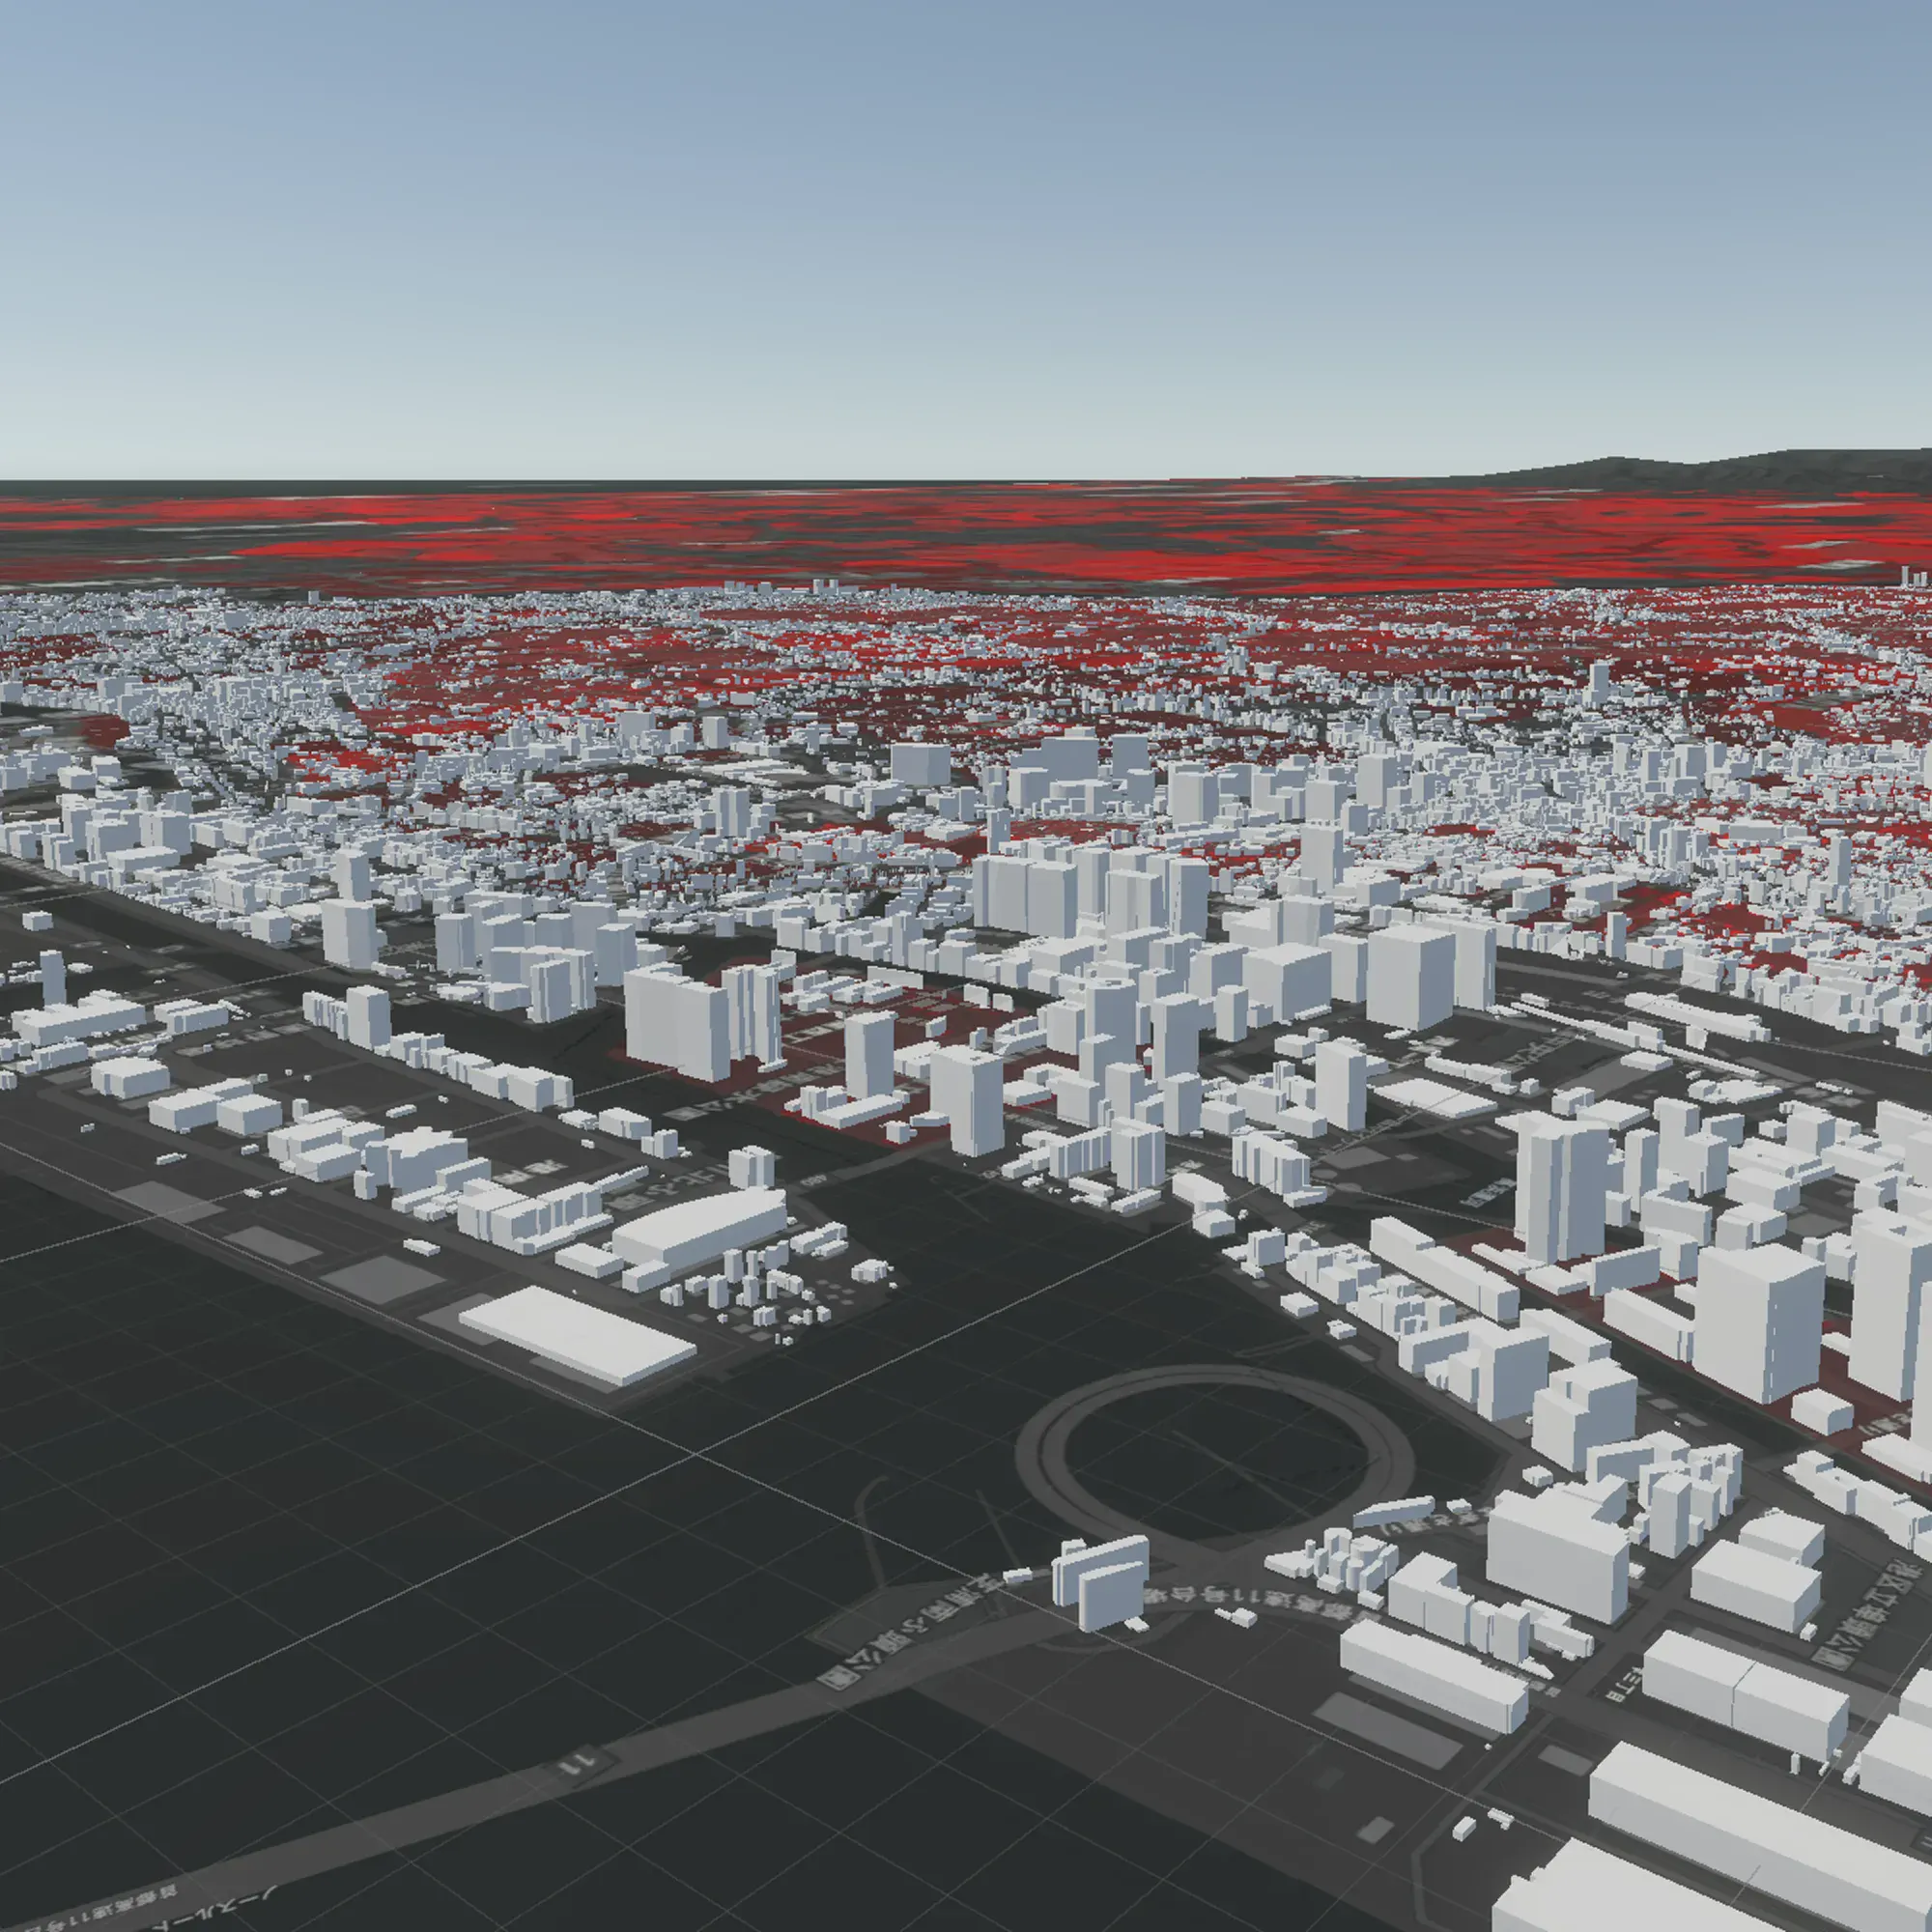
The depth is only worth it if the geography is real. We built the scenes on the ArcGIS Maps SDK, which streams hosted tile and scene layers into Unity as actual geometry, so Edmonton, Paris, and Tokyo are accurate to their source data, not modelled by hand.
ArcGIS · data path
From ArcGIS to the headset
Real geospatial data takes five hops to reach the headset. Select a stage to trace what it does, and where the engineering lived.
Real geospatial data takes five hops to reach the headset. Select a stage to trace what it does, and where the engineering lived.
Where the data pushed back
- 01
Locked to public data
The free ArcGIS account only allowed public tile and scene layers; custom uploads failed on hosting limits.
FixWe sourced quality public datasets, especially for cities like New York and Tokyo, for the prototype.
Layer system
Layers, in your hands
With the cities in the scene, the work was control: letting a planner toggle, fade, and read each dataset from inside the headset. My teammate handled locomotion, the SDK integration, and deployment; I built the interactive UI and the runtime layer control behind it.
- 01
The in-headset interface
I built the interface: visibility toggles, opacity sliders, and a toggleable legend, so users could explore and reshape the data in real time.
- 02
Interaction scripting
I scripted the behaviours behind it, data-layer switching and legend updates, and adapted inherited code to our visualization goals.
- 03
One UX across scenes
My teammate built the base environments from public datasets; I made sure each city scene (Edmonton, Paris, Tokyo) carried the same interaction and feel.
The in-headset UI
The control panel I built
This is the panel users reach into in VR. Pick a city, then toggle each data layer or dial its opacity. The legend follows, the same controls I scripted against the ArcGIS SDK.

Edmonton
Map select
Legend · Land Use
- Industrial
- Commercial
- Institutional
- Residential
The real panel, in the headset
Where it got hard
- 01
No docs for runtime layer control
Controlling data layers from the UI at runtime meant working around sparse ArcGIS API documentation.
FixI read through the SDK scripts and wrote custom functions to toggle visibility, adjust opacity, and switch legends on the fly.
- 02
Unity files broke Git
Unity's large files blew past GitHub's storage limits and stalled collaboration.
FixWe moved to Unity DevOps, which handled the big files and kept us working in parallel.
Reverse-engineering the SDK
Runtime layer control was not in the docs, so I read our toggle code against the SDK's own layer loop and wrote the functions to bridge them.
Runtime layer control
Step through the bridge
There was no runtime API for layer visibility, so I read the SDK's load loop and wrote this. Pick a target, then step through it: the loop checks every layer, matches by name, and flips IsVisible in place.
-
// runtime visibility, reverse-engineered from the load loop -
void SetLayerVisible(string target, bool next) { -
for (ulong i = 0; i < map.Layers.GetSize(); i++) { -
var layer = map.Layers.At(i); -
if (layer.Name == target) -
layer.IsVisible = next; -
} -
}
Watch
- i
- —
- layer.Name
- —
- Name == target
- —
- layer.IsVisible
- —
Ready. Pick a target, then Step or Run.
Comfort & locomotion
What the headset taught us about comfort
We ran a structured testing session to see how easily people could navigate and read spatial data in VR, and whether the controls were intuitive for everyone.
- Worked
The layer toggles and opacity controls were effective for exploring spatial data.
- Worked
Scene switching between cities was smooth and well received.
- To fix
Users wanted continuous turning instead of snap-turning for smoother navigation.
- To fix
Ascend and descend controls were missing, limiting full vertical movement.
- To fix
Scene boundaries were unclear; some users accidentally flew below the map.
What we would add next
The fixes testing asked for
Three gaps came up the most. Toggle them on to see how each would change the scene.
Outcome
A working build, and what it proved
We could not ship the testing changes inside the semester, but we delivered a functional Meta Quest build that proved spatial data exploration works in VR, and grew our design and development chops in the process.
Reflection
- 01
The bridge was the real work
The visible win was a VR map; the engineering win was the runtime layer control, reading the ArcGIS SDK load loop and writing the functions it never documented. That is the part I would build again.
- 02
Constraints taught resourcefulness
Limits in the ArcGIS SDK, Unity version control, and VR builds pushed us to alternate tools and workflows, and to get comfortable shipping on unfamiliar platforms.
- 03
Designing for the headset, not the screen
Comfort, locomotion, and a panel you can reach by hand are not polish in VR; they decide whether the data is usable at all. Testing made that concrete.