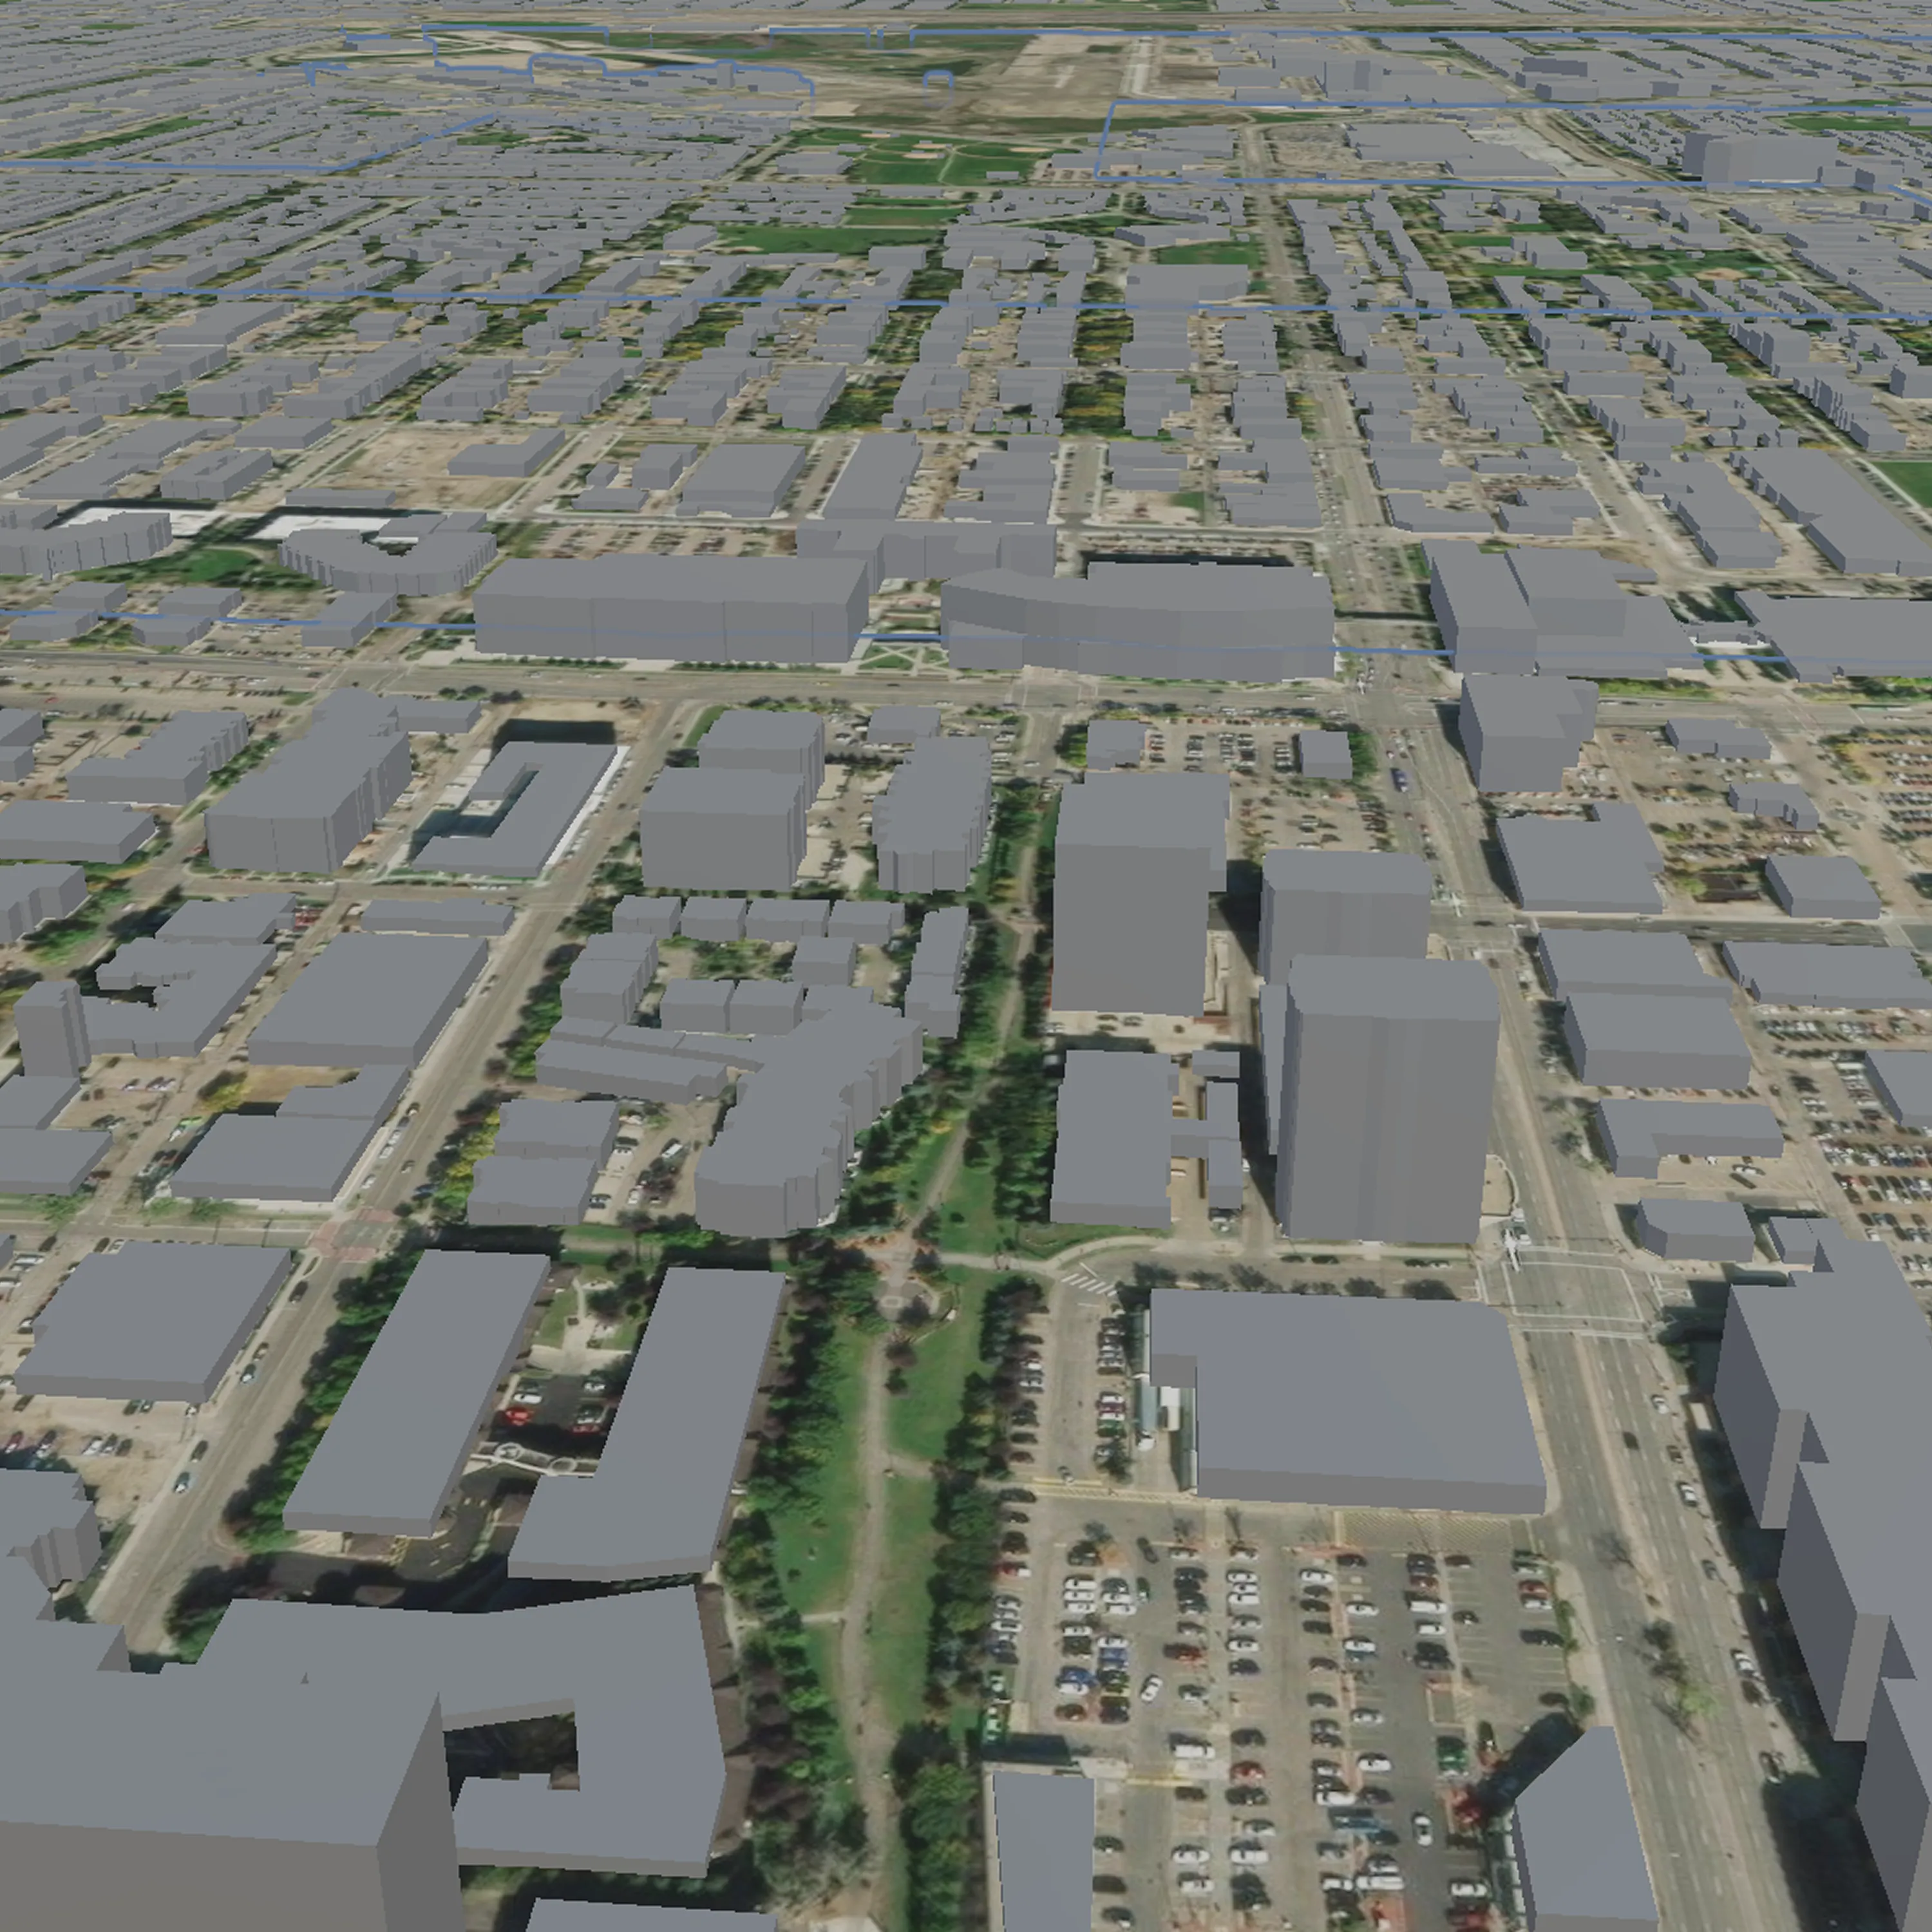
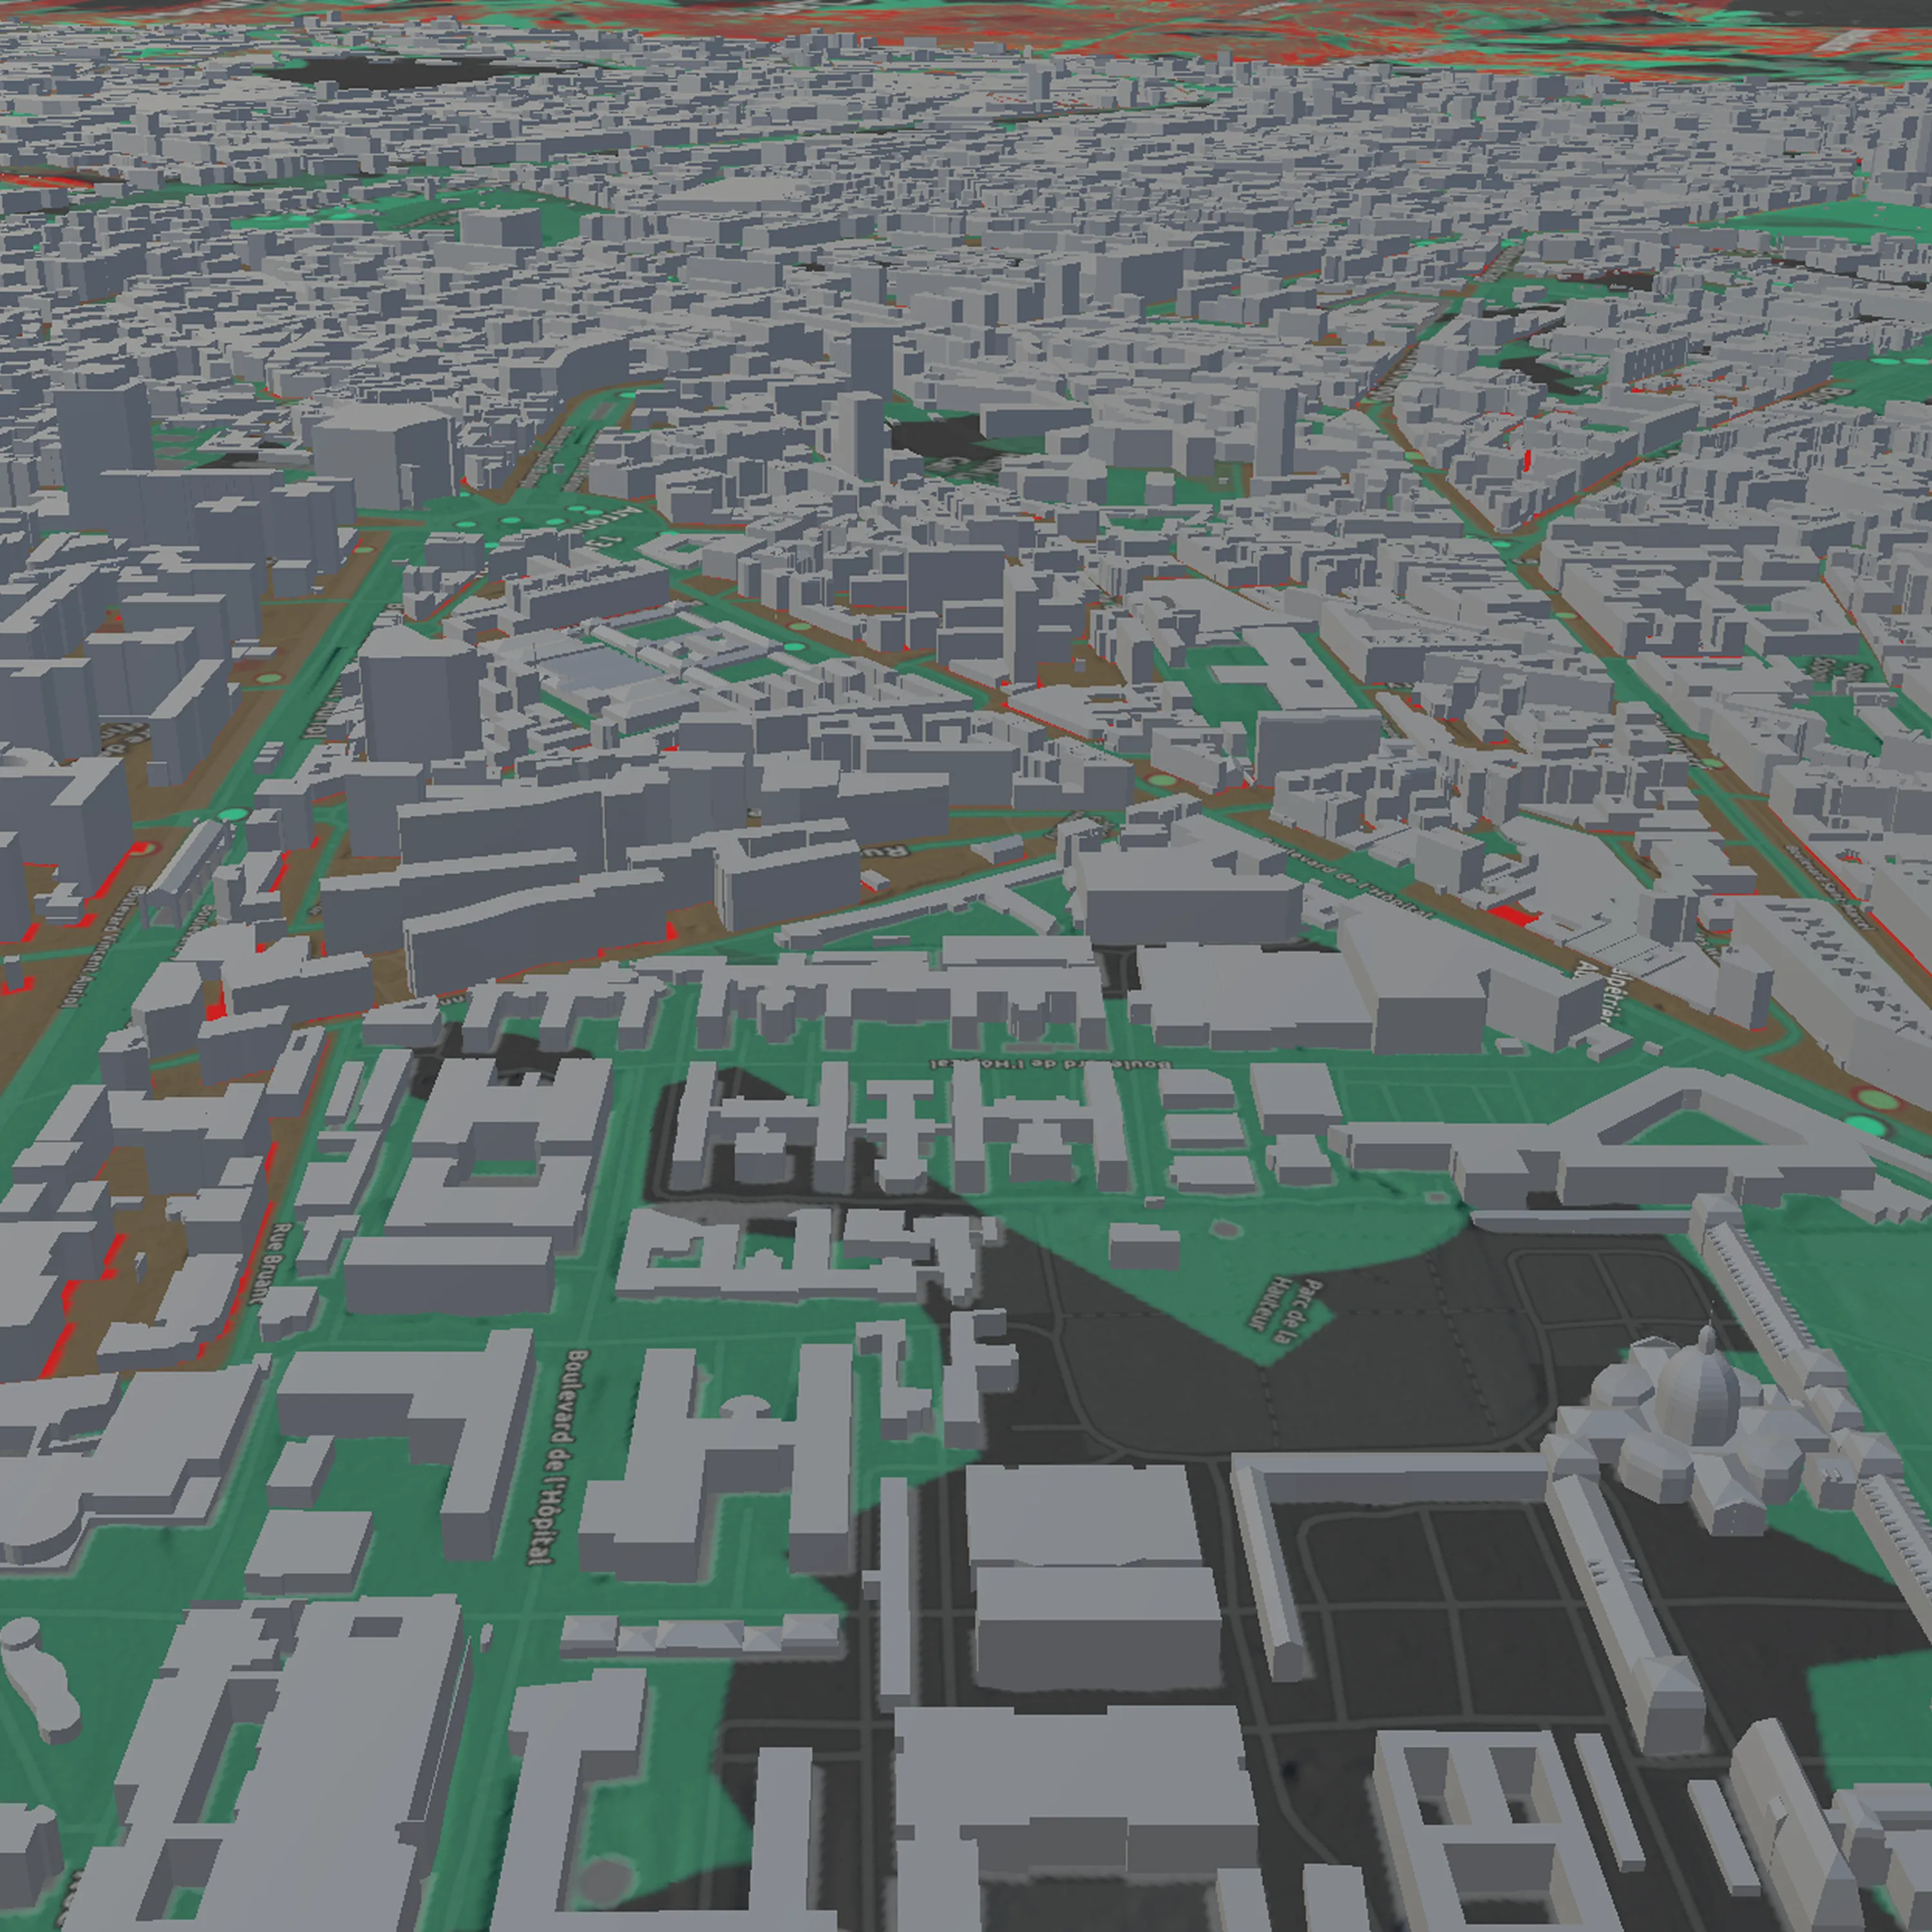
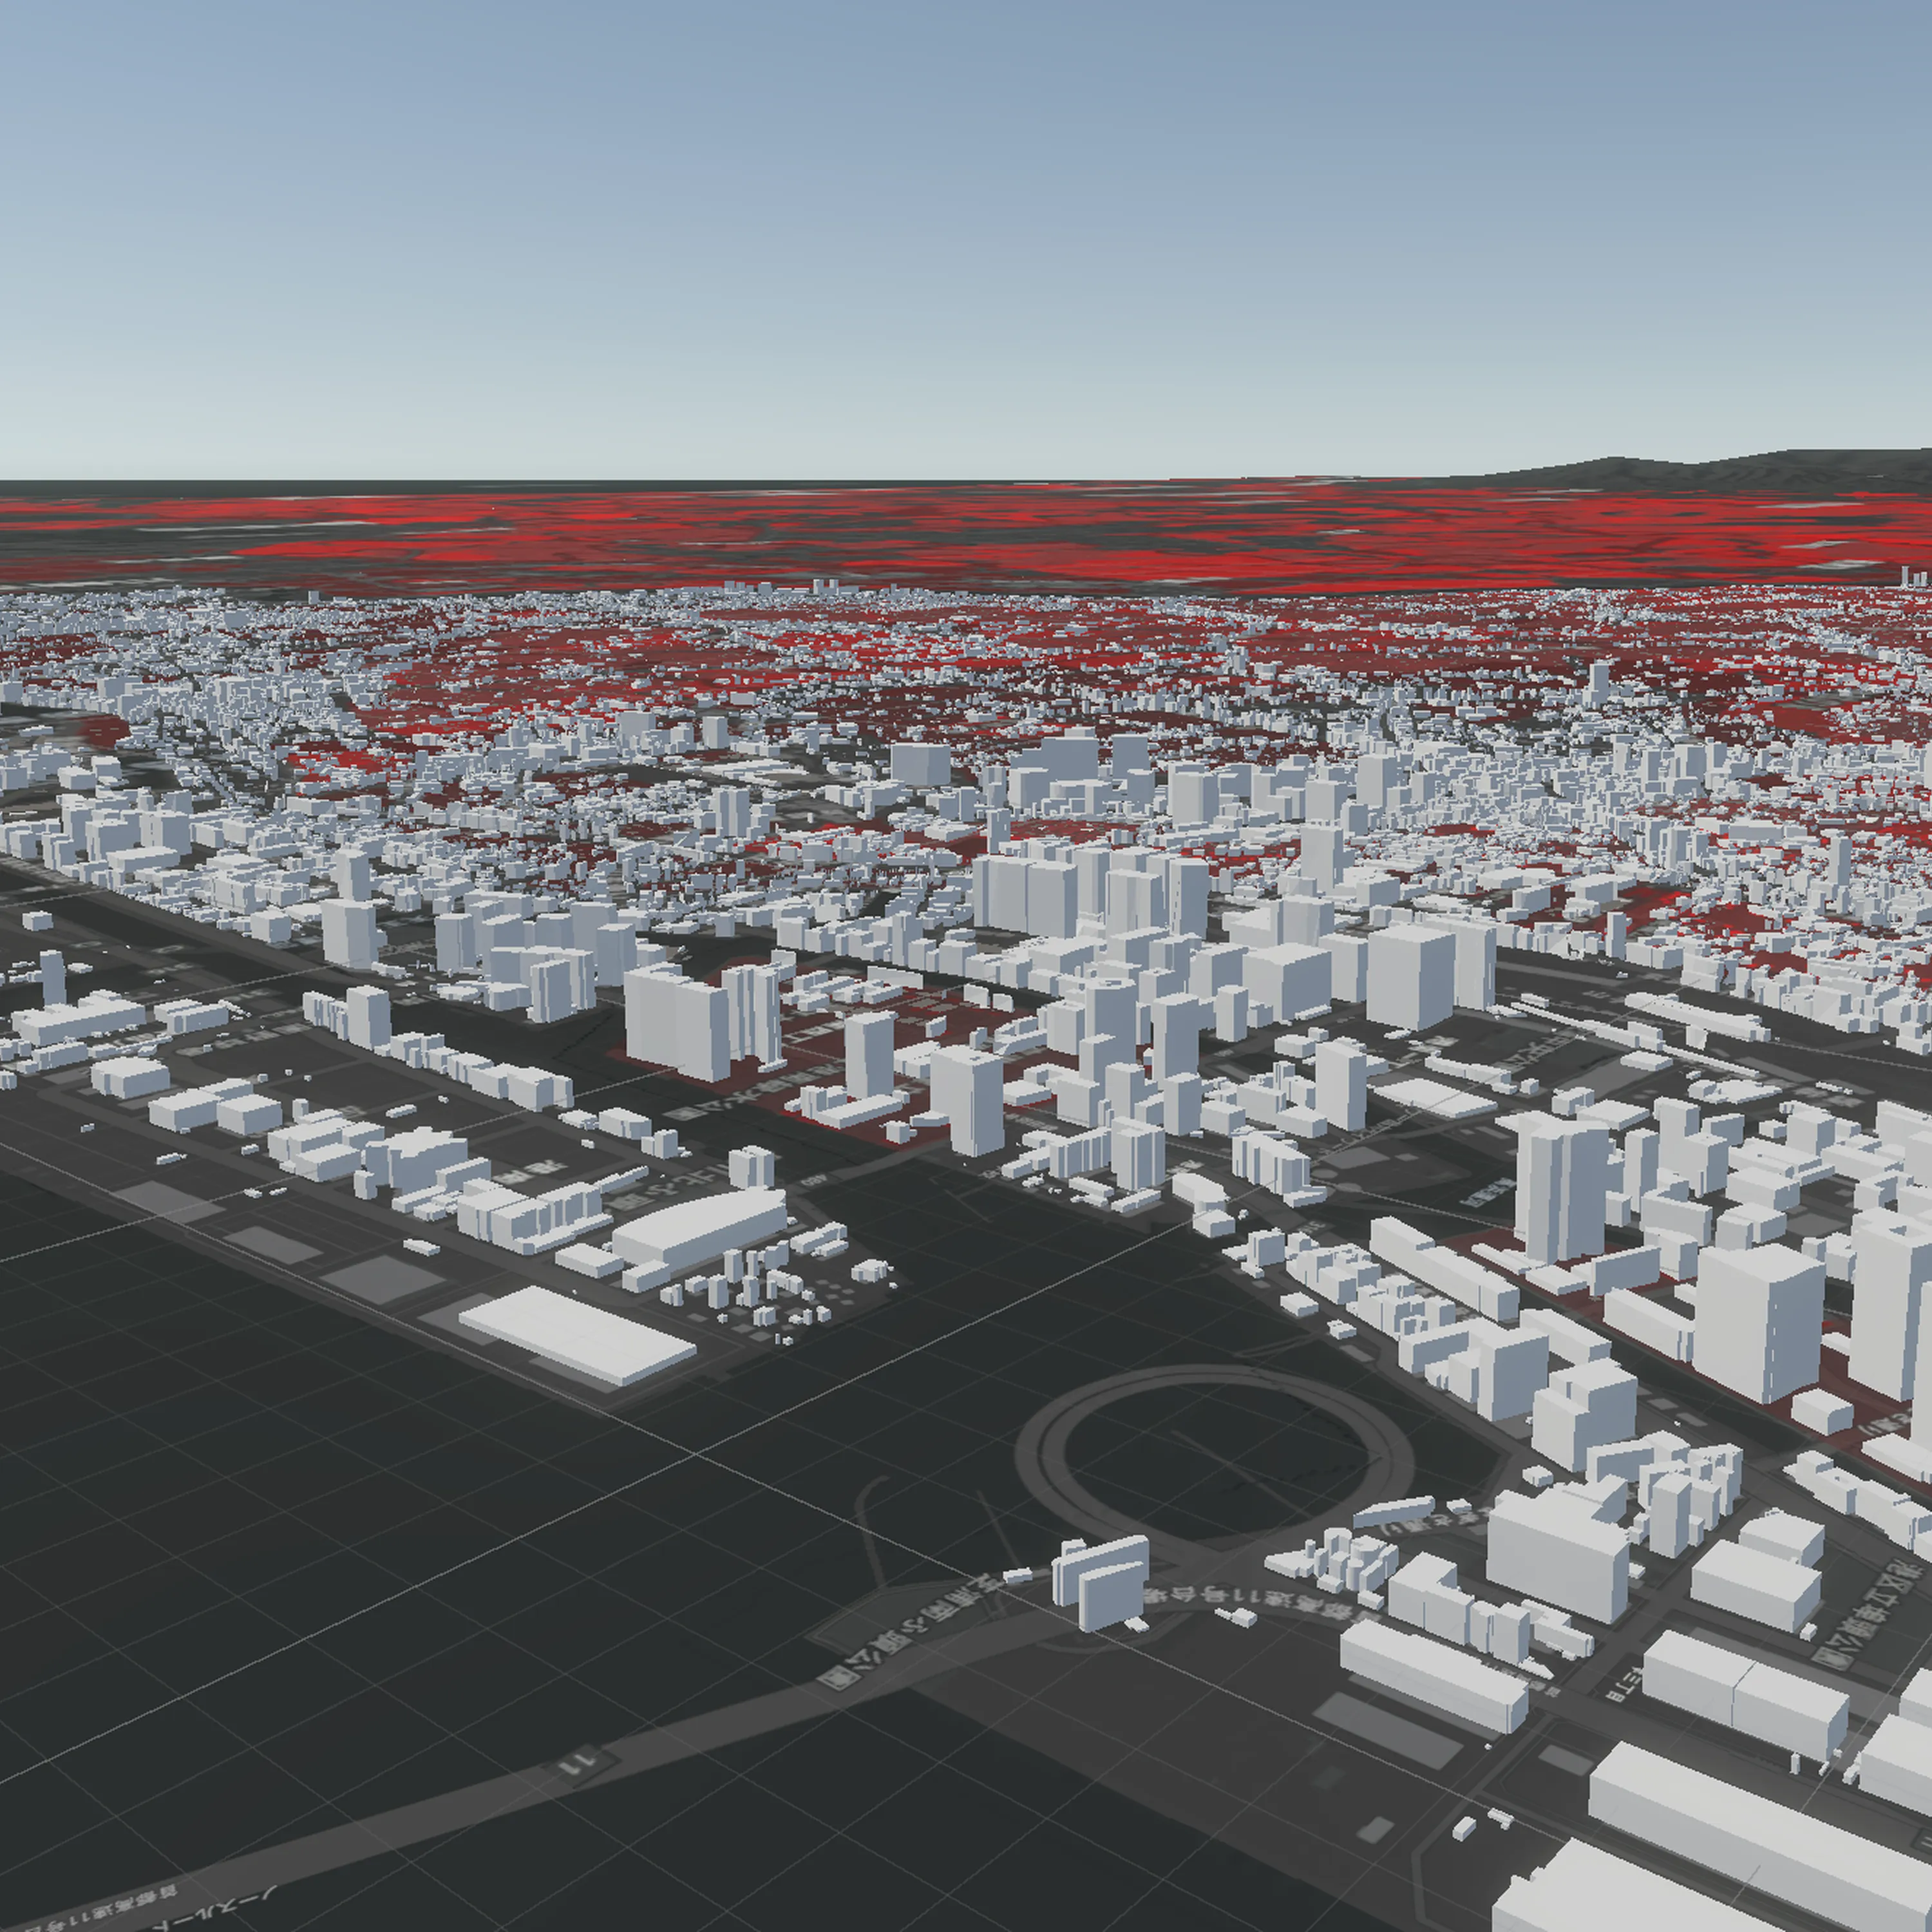
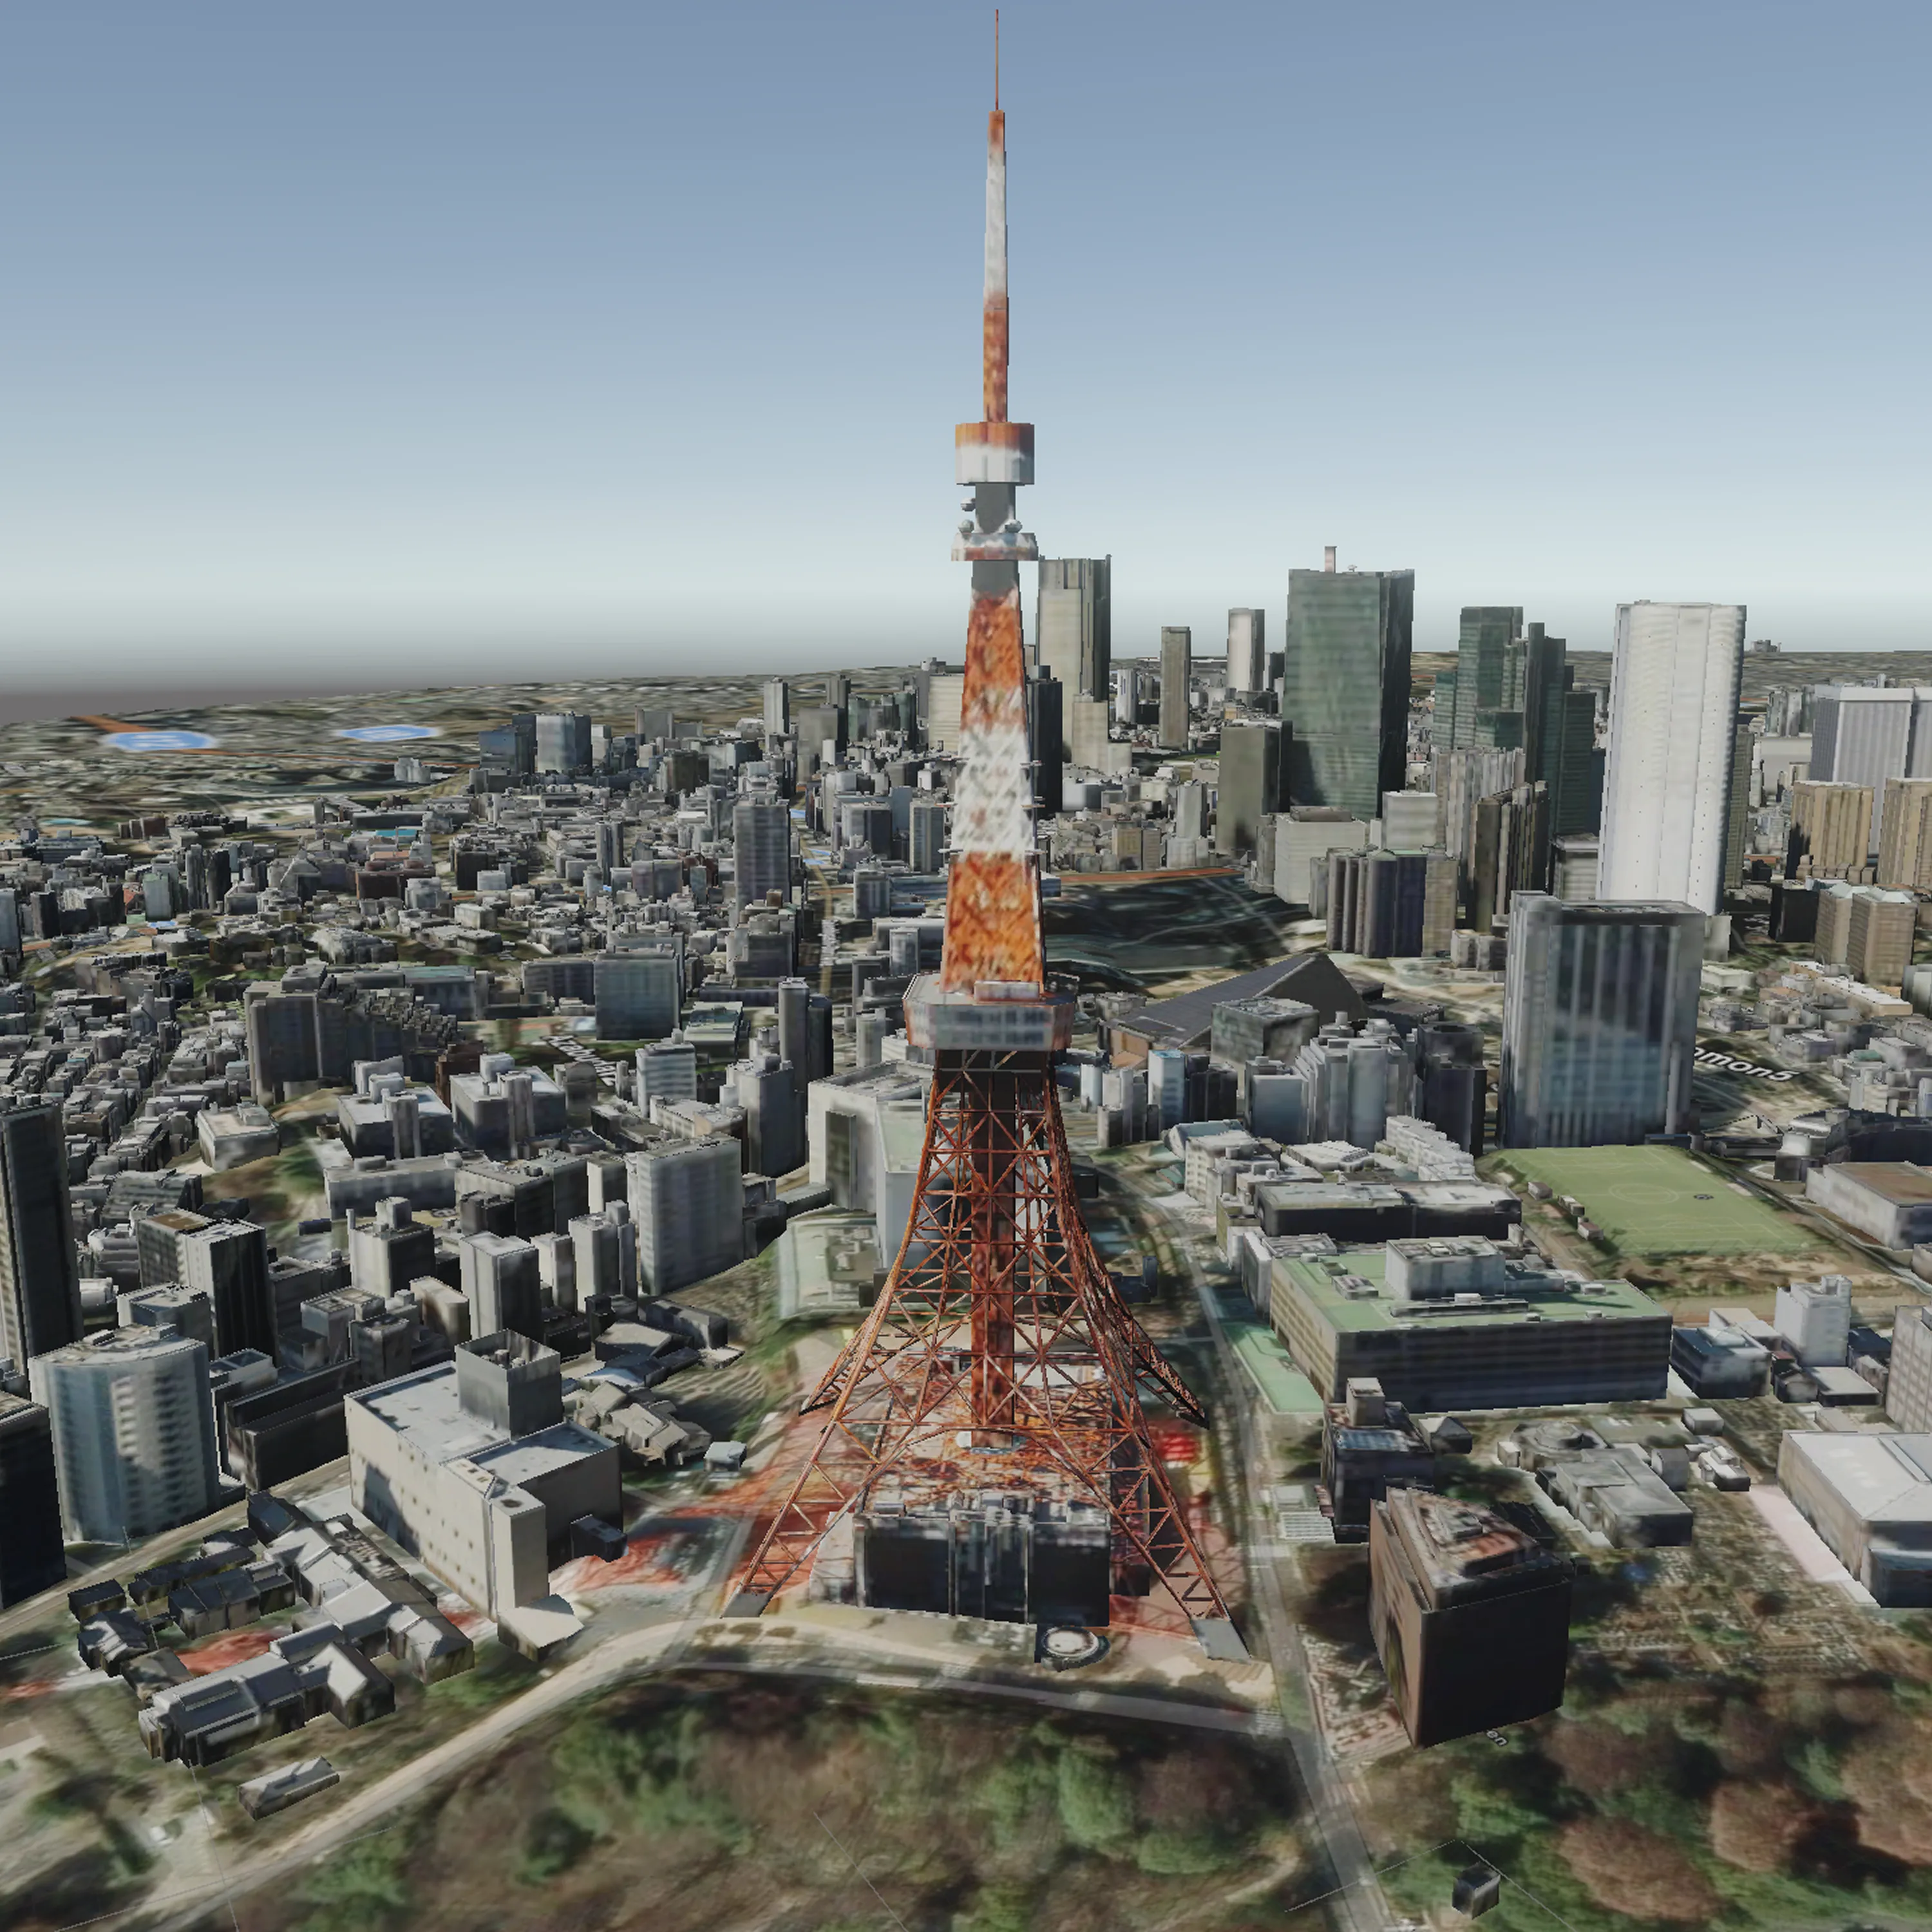
Scenes (Edmonton, Paris, Tokyo, Rendered Buildings)

A VR application for Meta Quest that lets urban planners and analysts explore layered geospatial data in 3D with hand-based controls, interactive UI, and real-world datasets.
As the Lead UX & Interaction Designer and VR Developer for this project, I played the main role in developing the user interface. I also implemented the Unity prototype with hand-based interactions and integrated the ArcGIS Maps SDK to ensure smooth transition between scenes.
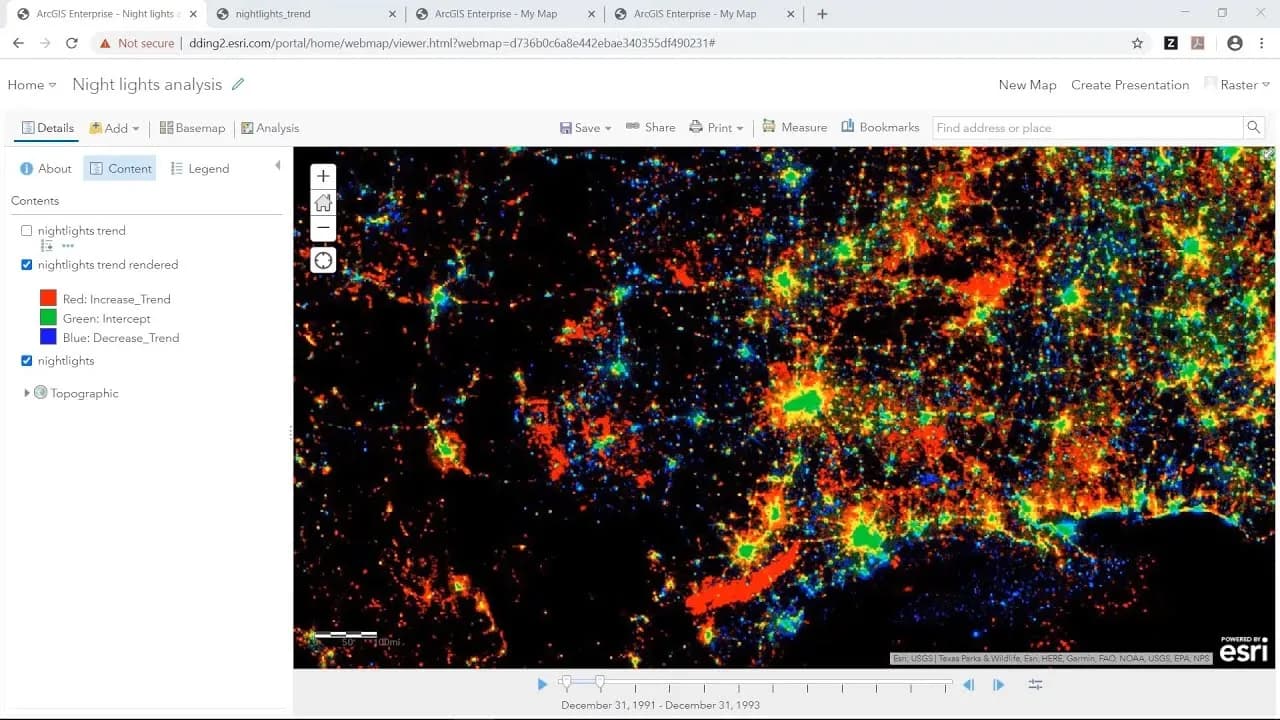
Working with geospatial data often involves parsing complex, layered information all within tools designed primarily for 2D or 3D viewing. These tools are powerful but can be dense, cognitively demanding, and require several other tools for a simple task. For professionals like urban planners or analysts, making sense of spatial relationships across disconnected maps and dashboards isn’t just inefficient and it can obscure critical insights. This environment presents unique challenges for clarity, context, and communication.
2D views limit spatial understanding
Traditional map and dashboard tools force users to interpret complex geospatial data on flat screens, limiting depth perception and spatial reasoning.
Multiple tools required for specific workflows
Analysts frequently switch between multiple applications or browser tabs to access different data, leading to disjointed analysis.
Difficulty interpreting layers without context
Whether zoning, demographics, or infrastructure, professionals like urban planners, data scientists, and policymakers benefit from viewing multi-layered geospatial information in a shared 3D context.
Underutilization of Immersive Technologies
While 3D and VR technologies have been explored in other domains, a gap exists in applying immersive VR environments specifically to geospatial datasets.
Rather than relying on static, screen-based tools, we introduced a fully immersive VR experience tailored for spatial data exploration. Built in Unity and optimized for the Meta Quest 3, our solution emphasizes intuitive interaction and deeper comprehension through:
Immersive 3D Environment with Natural Navigation
Our solution immerses users in interactive 3D environments with intuitive hand-based navigation, making spatial data exploration more natural and insightful.
Interactive Layer Management
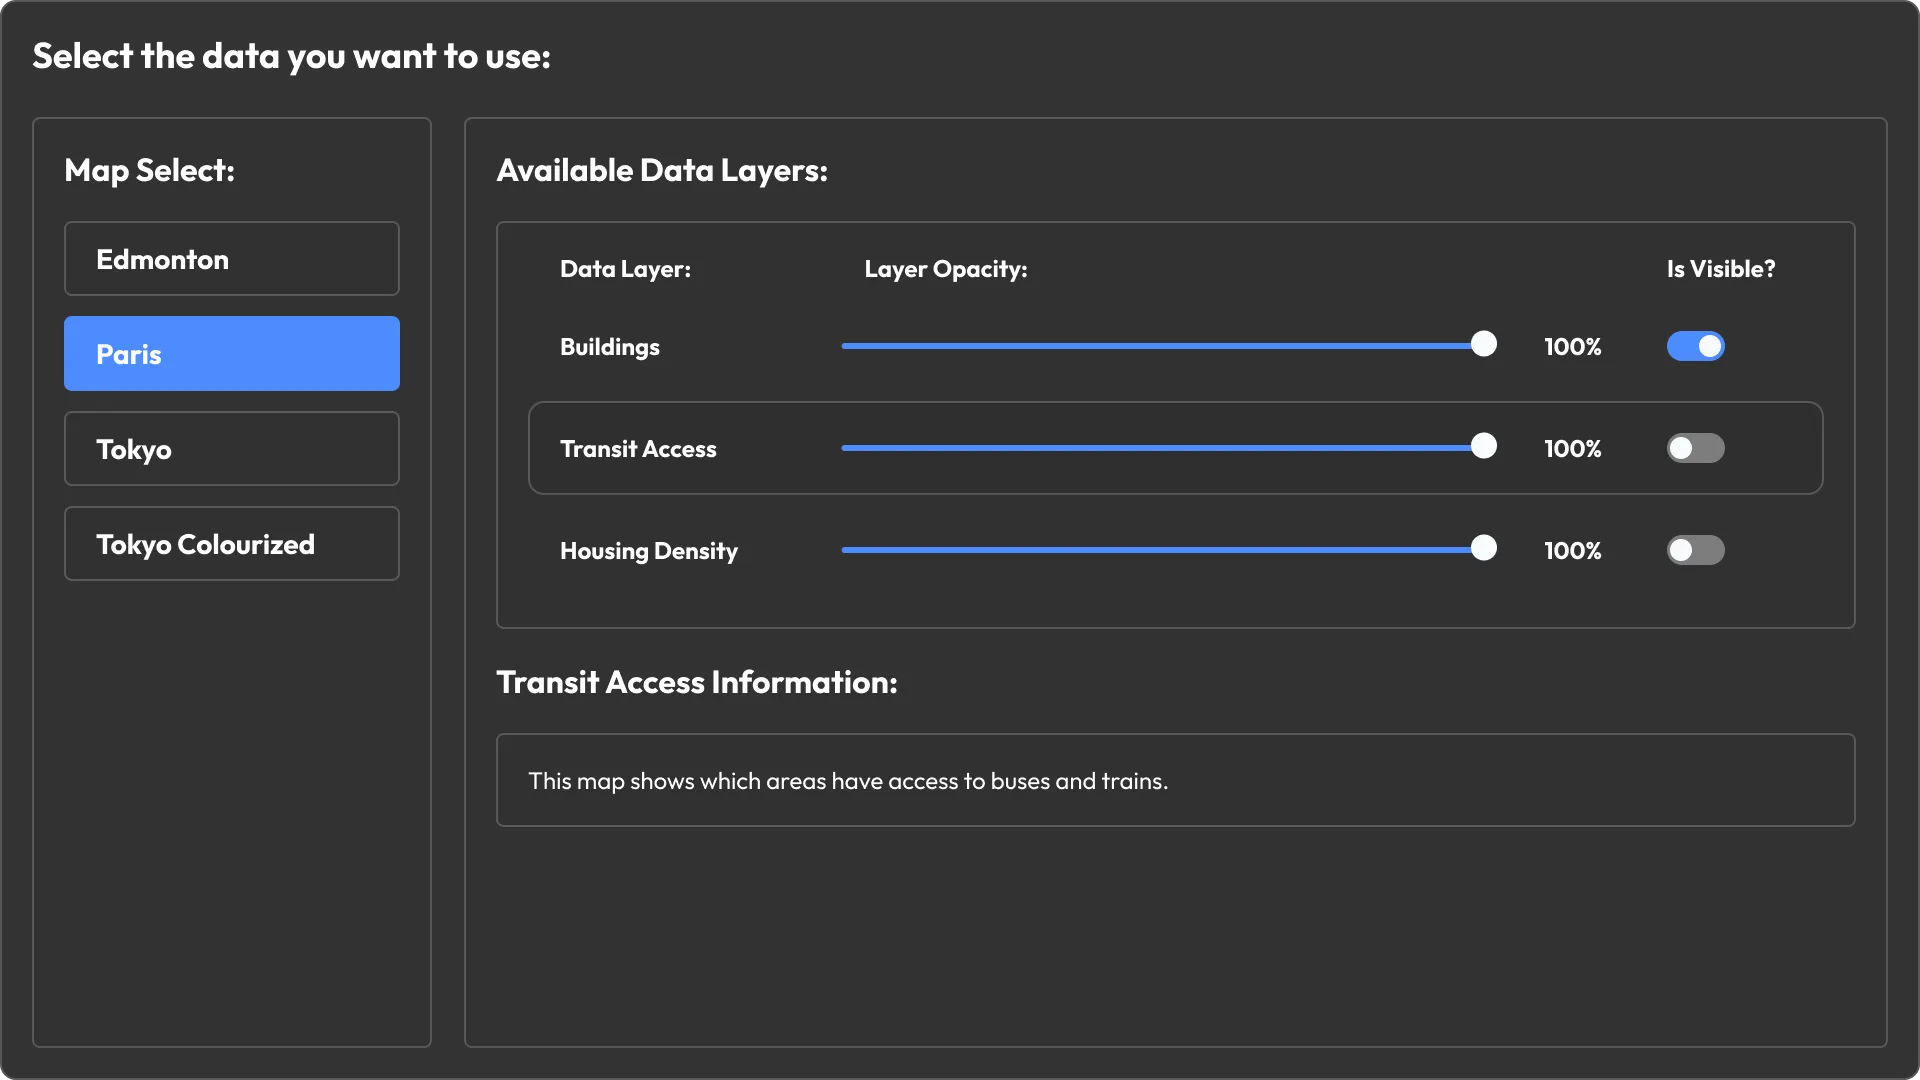
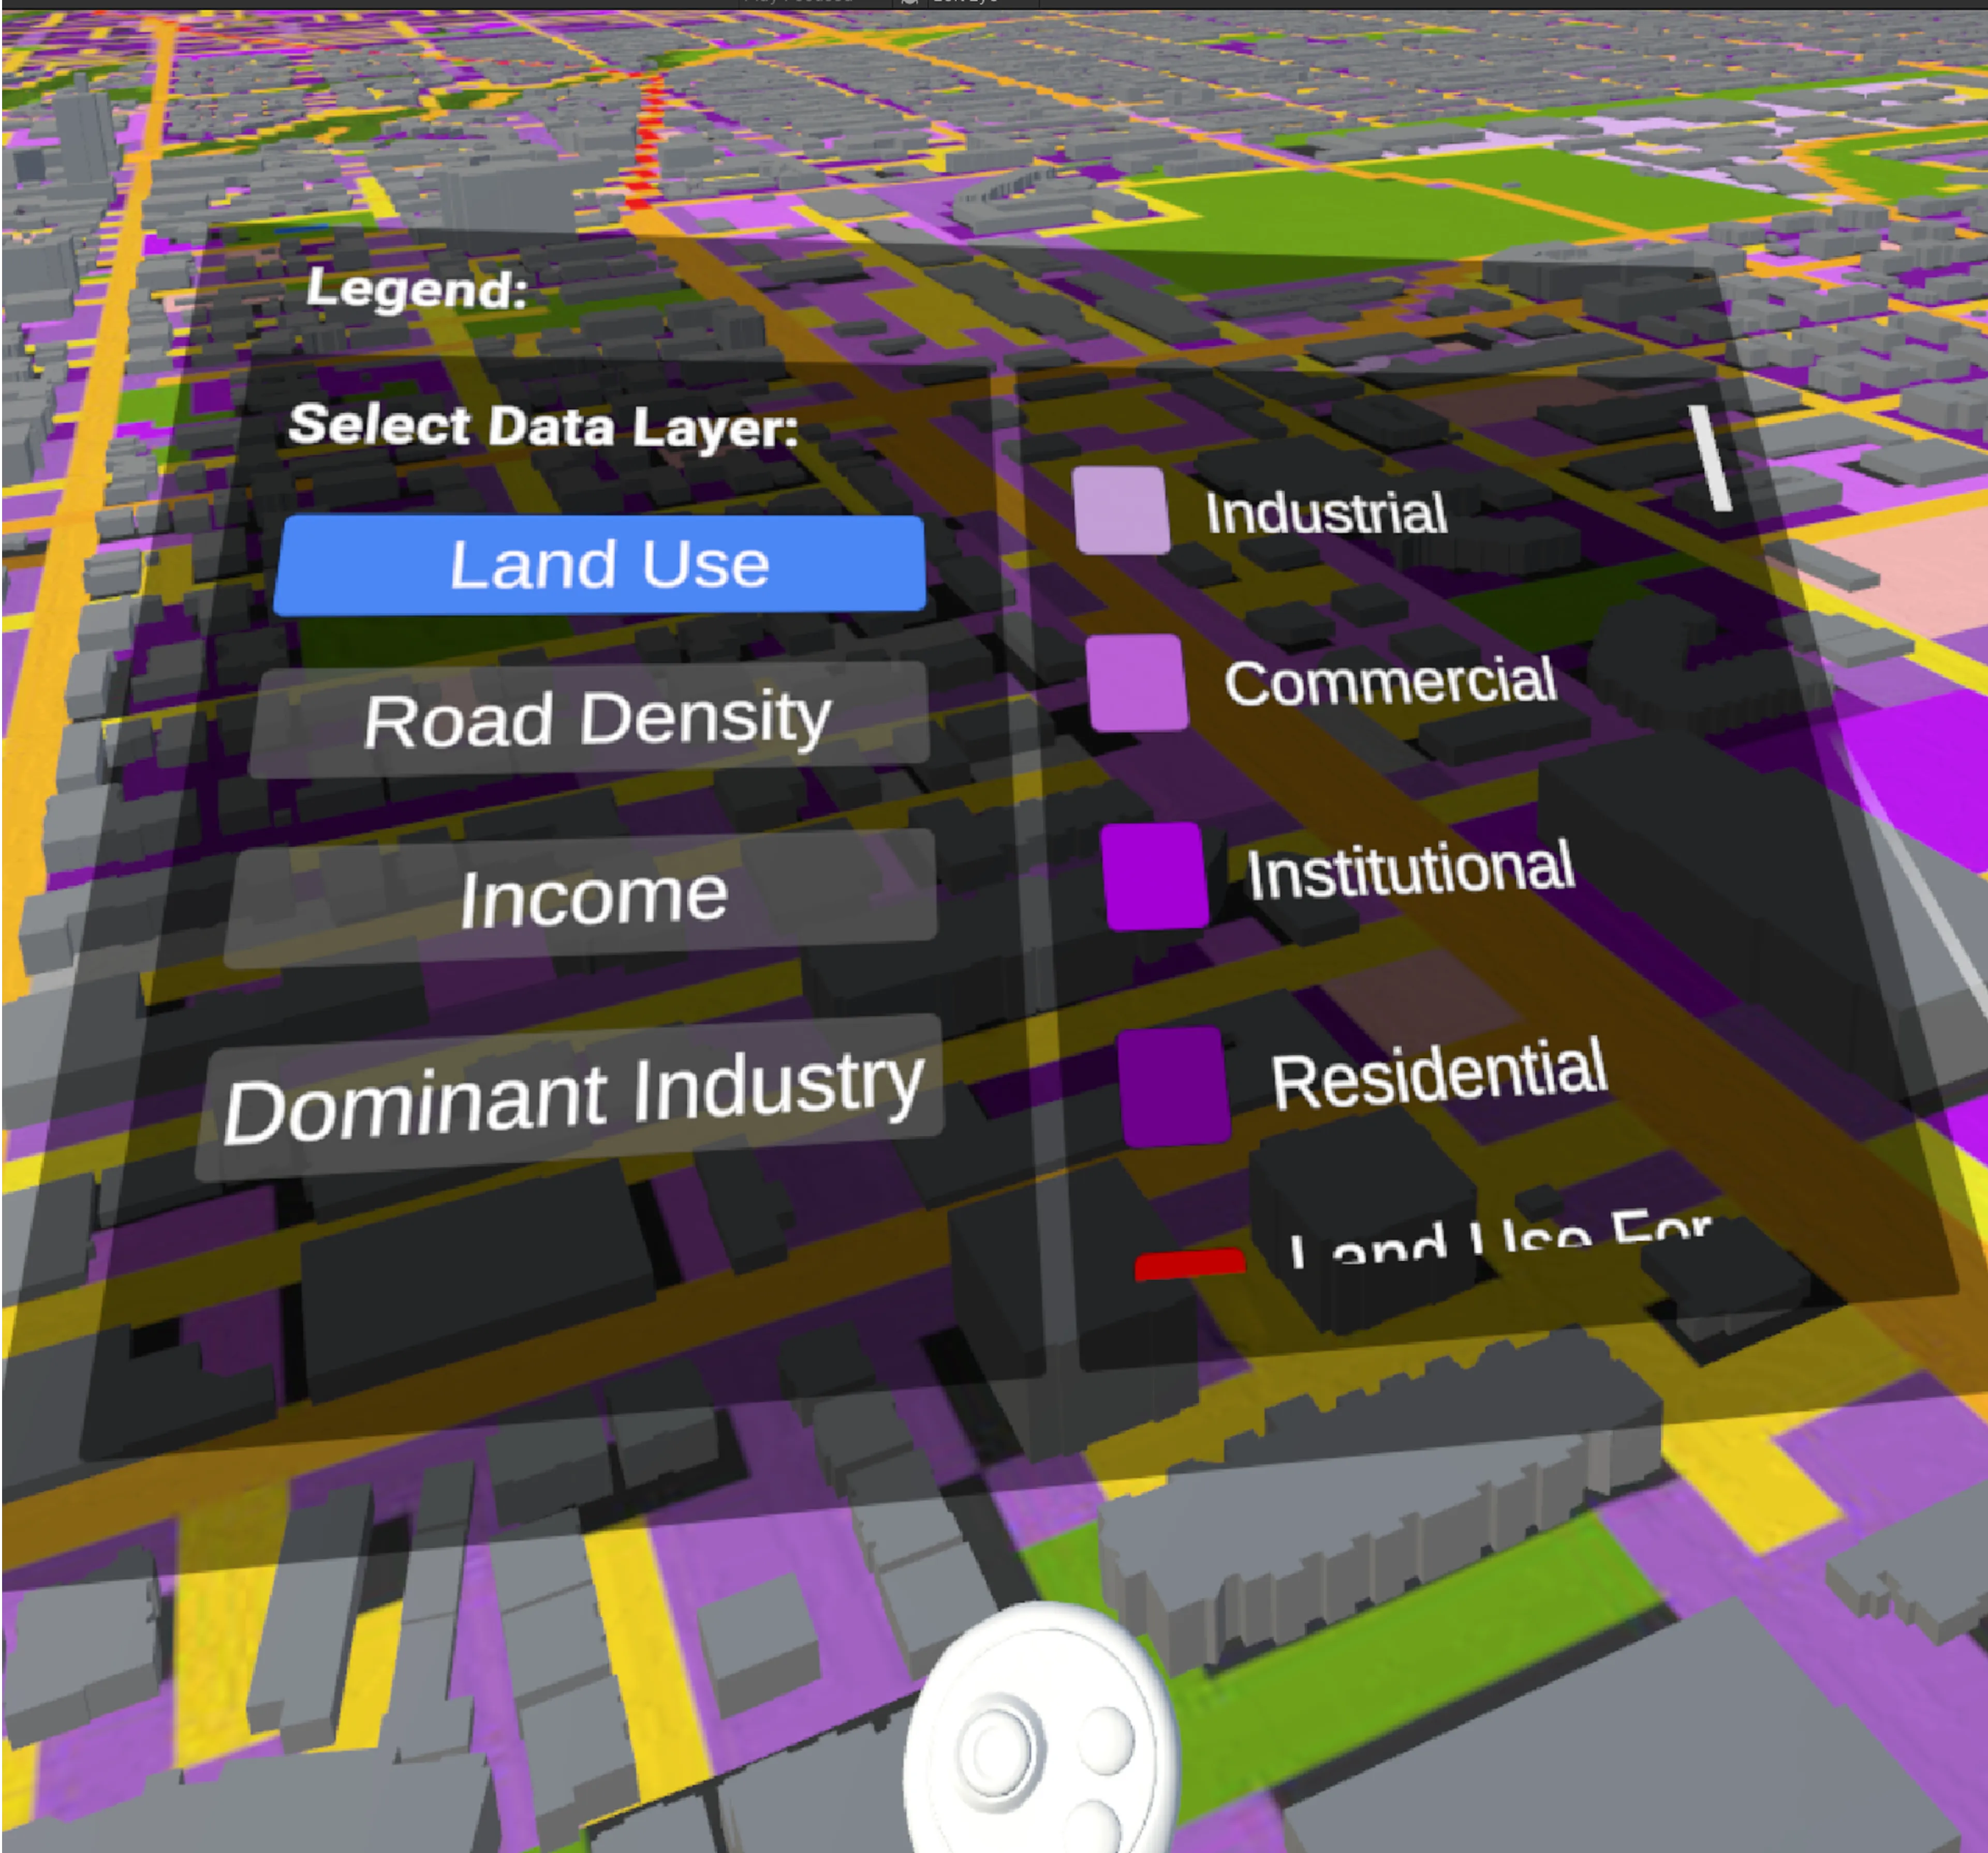
Users can toggle visibility, adjust opacity, and enable or disable specific data overlays through an accessible, in-world UI panel.
Reduced Cognitive Load Through Immersive Exploration
By placing users directly inside a three-dimensional map, the system leverages kinesthetic and spatial learning strategies to make complex spatial relationships easier to understand.
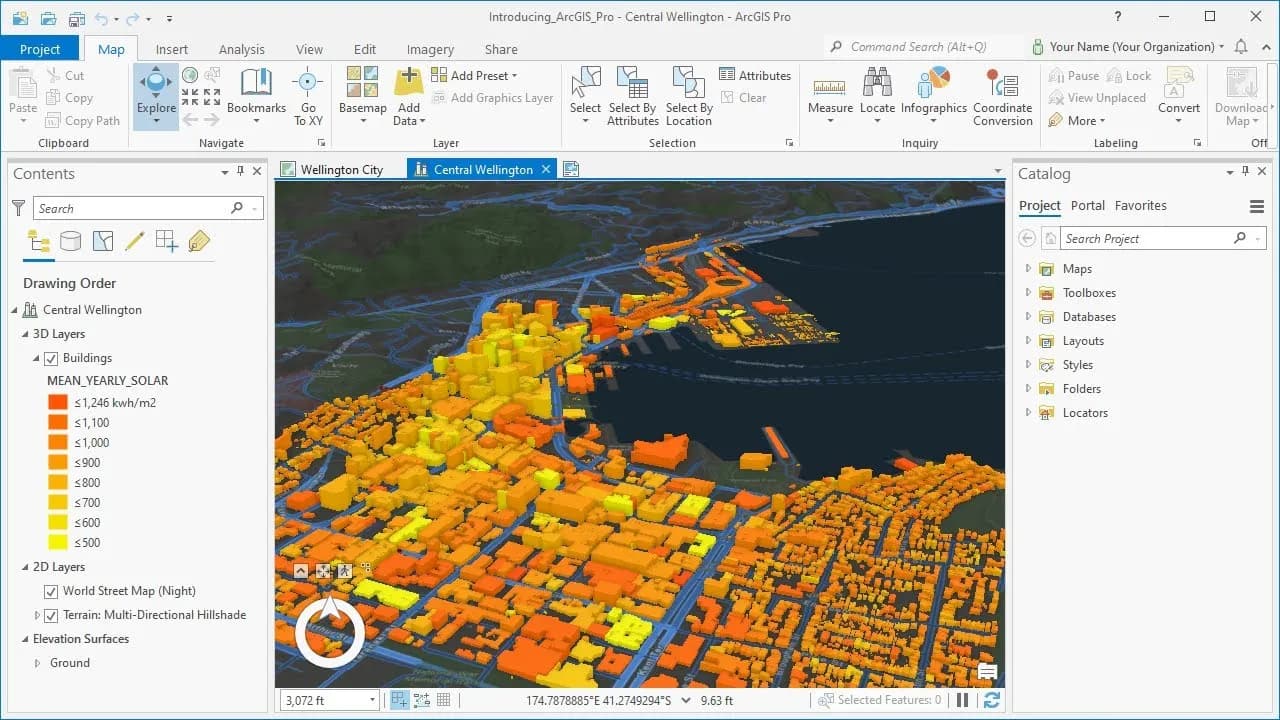
Integration with ArcGIS for Real-World Data Fidelity
The app uses the ArcGIS Maps SDK to bring in high-accuracy geographic data, enabling stakeholders to analyze real-world information in a realistic and interactive context.
My teammate and I reviewed existing research and defined user needs through persona development to understand the existing issues with traditional spatial data viewing methods. This initial research helped clarify how traditional geospatial tools fall short, especially compared to more immersive technologies like VR.
"As an urban planner, I want to intuitively explore layered geospatial data in a virtual environment to quickly understand spatial relationships and make informed planning decisions."

"I need to see how all the layers interact such as elevation, zoning, and infrastructure without flipping between ten different maps."
Informed by our early research, technical constraints and problem definition, I led the ideation and interface design process, focusing on translating spatial data interactions into an intuitive, immersive VR experience. My work centred on creating a flow that would feel natural to both VR newcomers and experienced users.
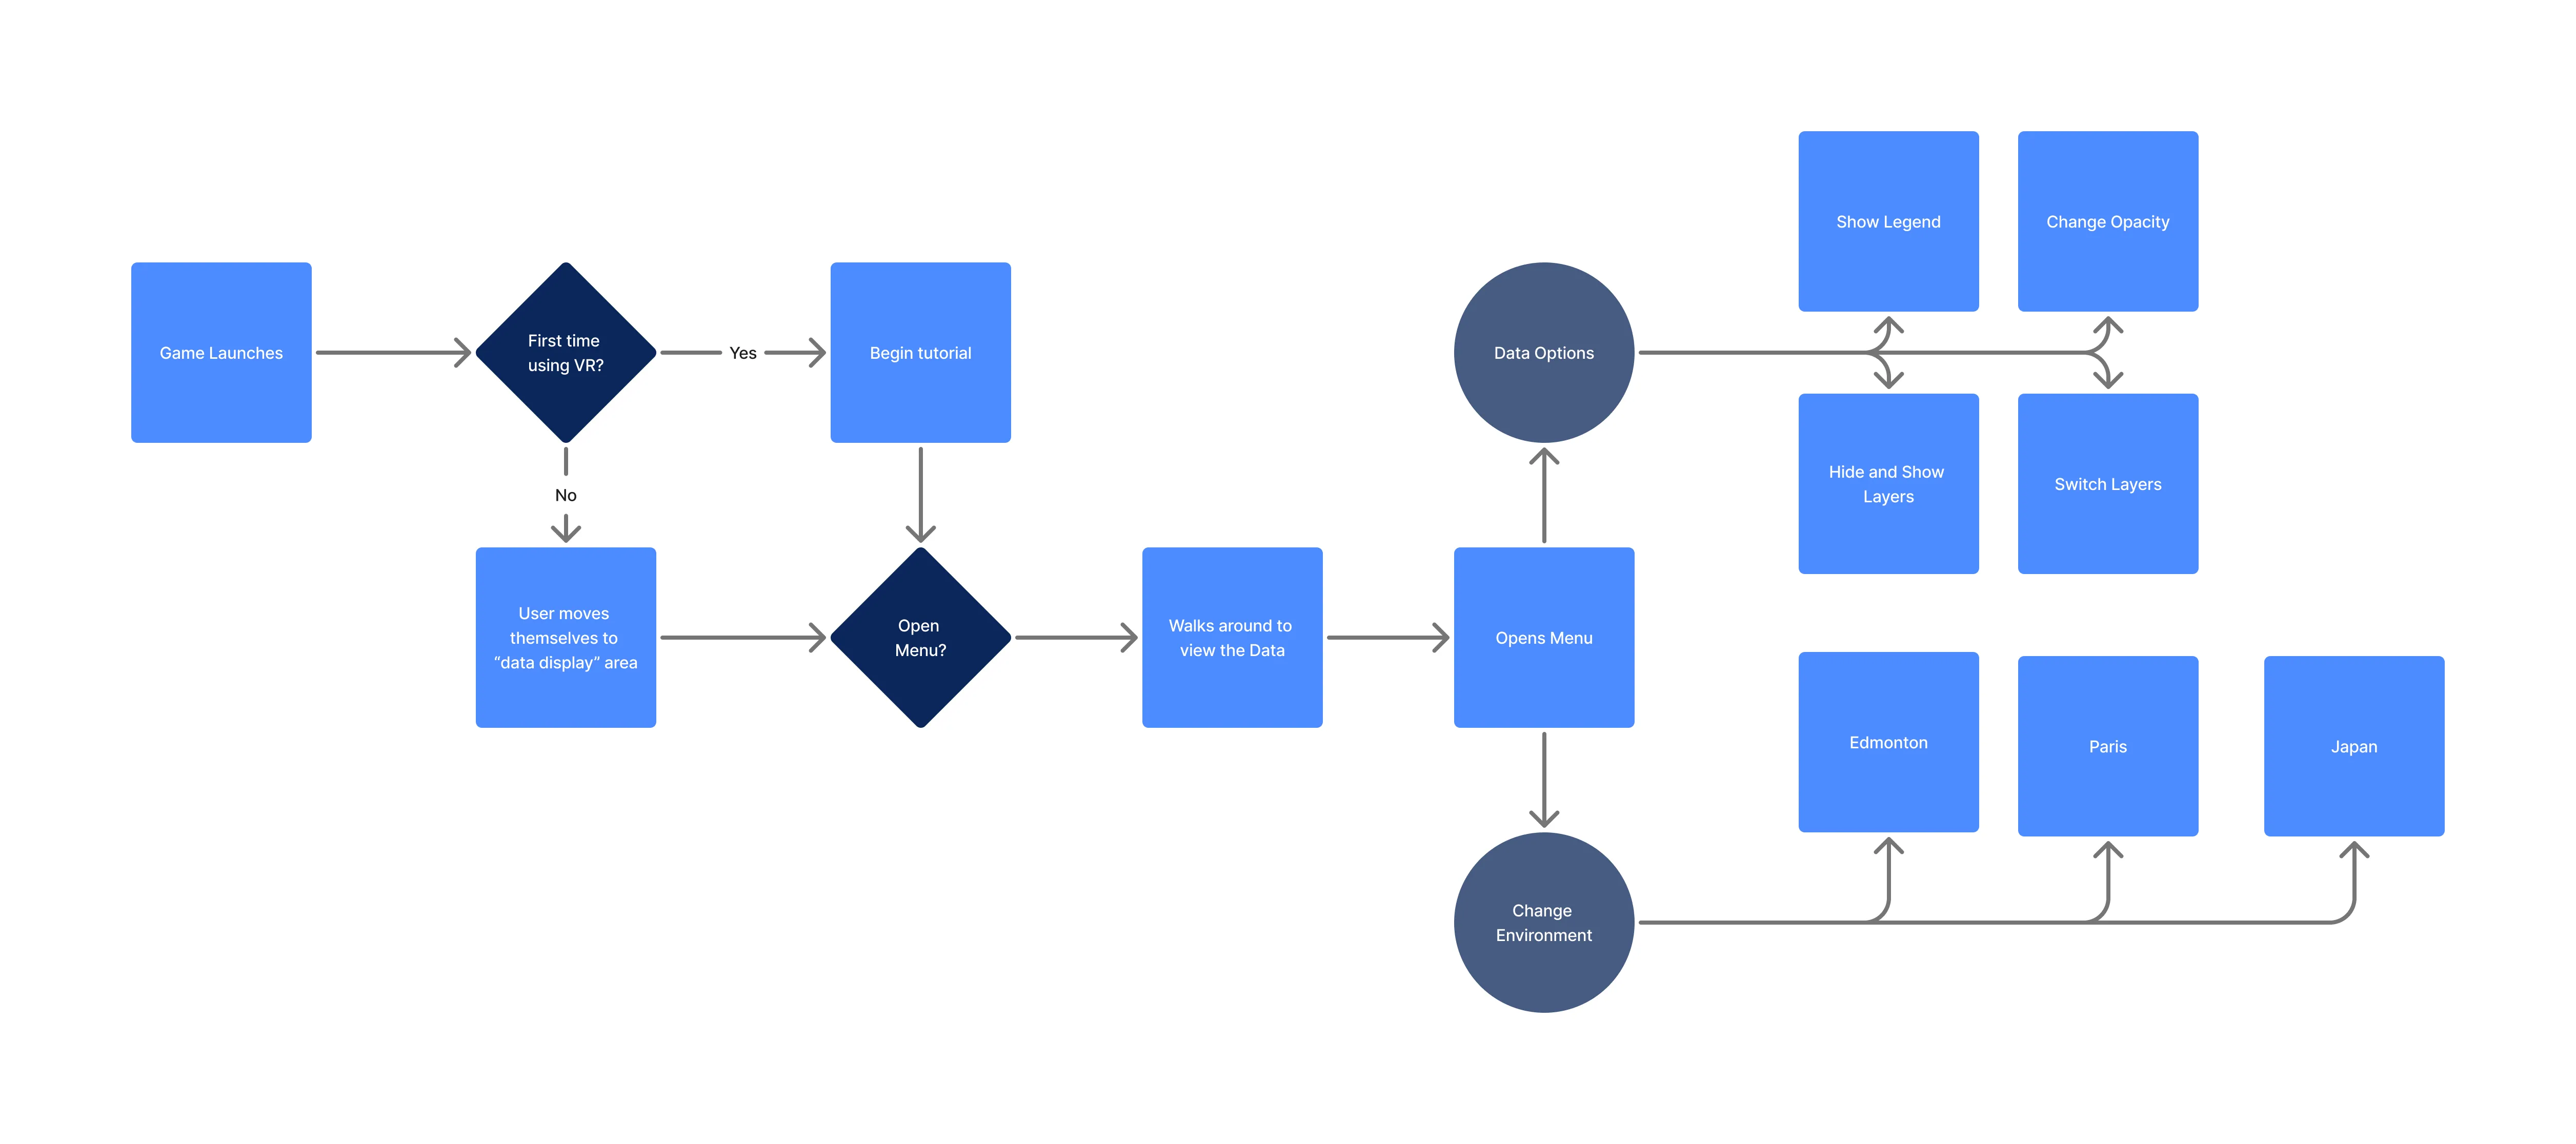
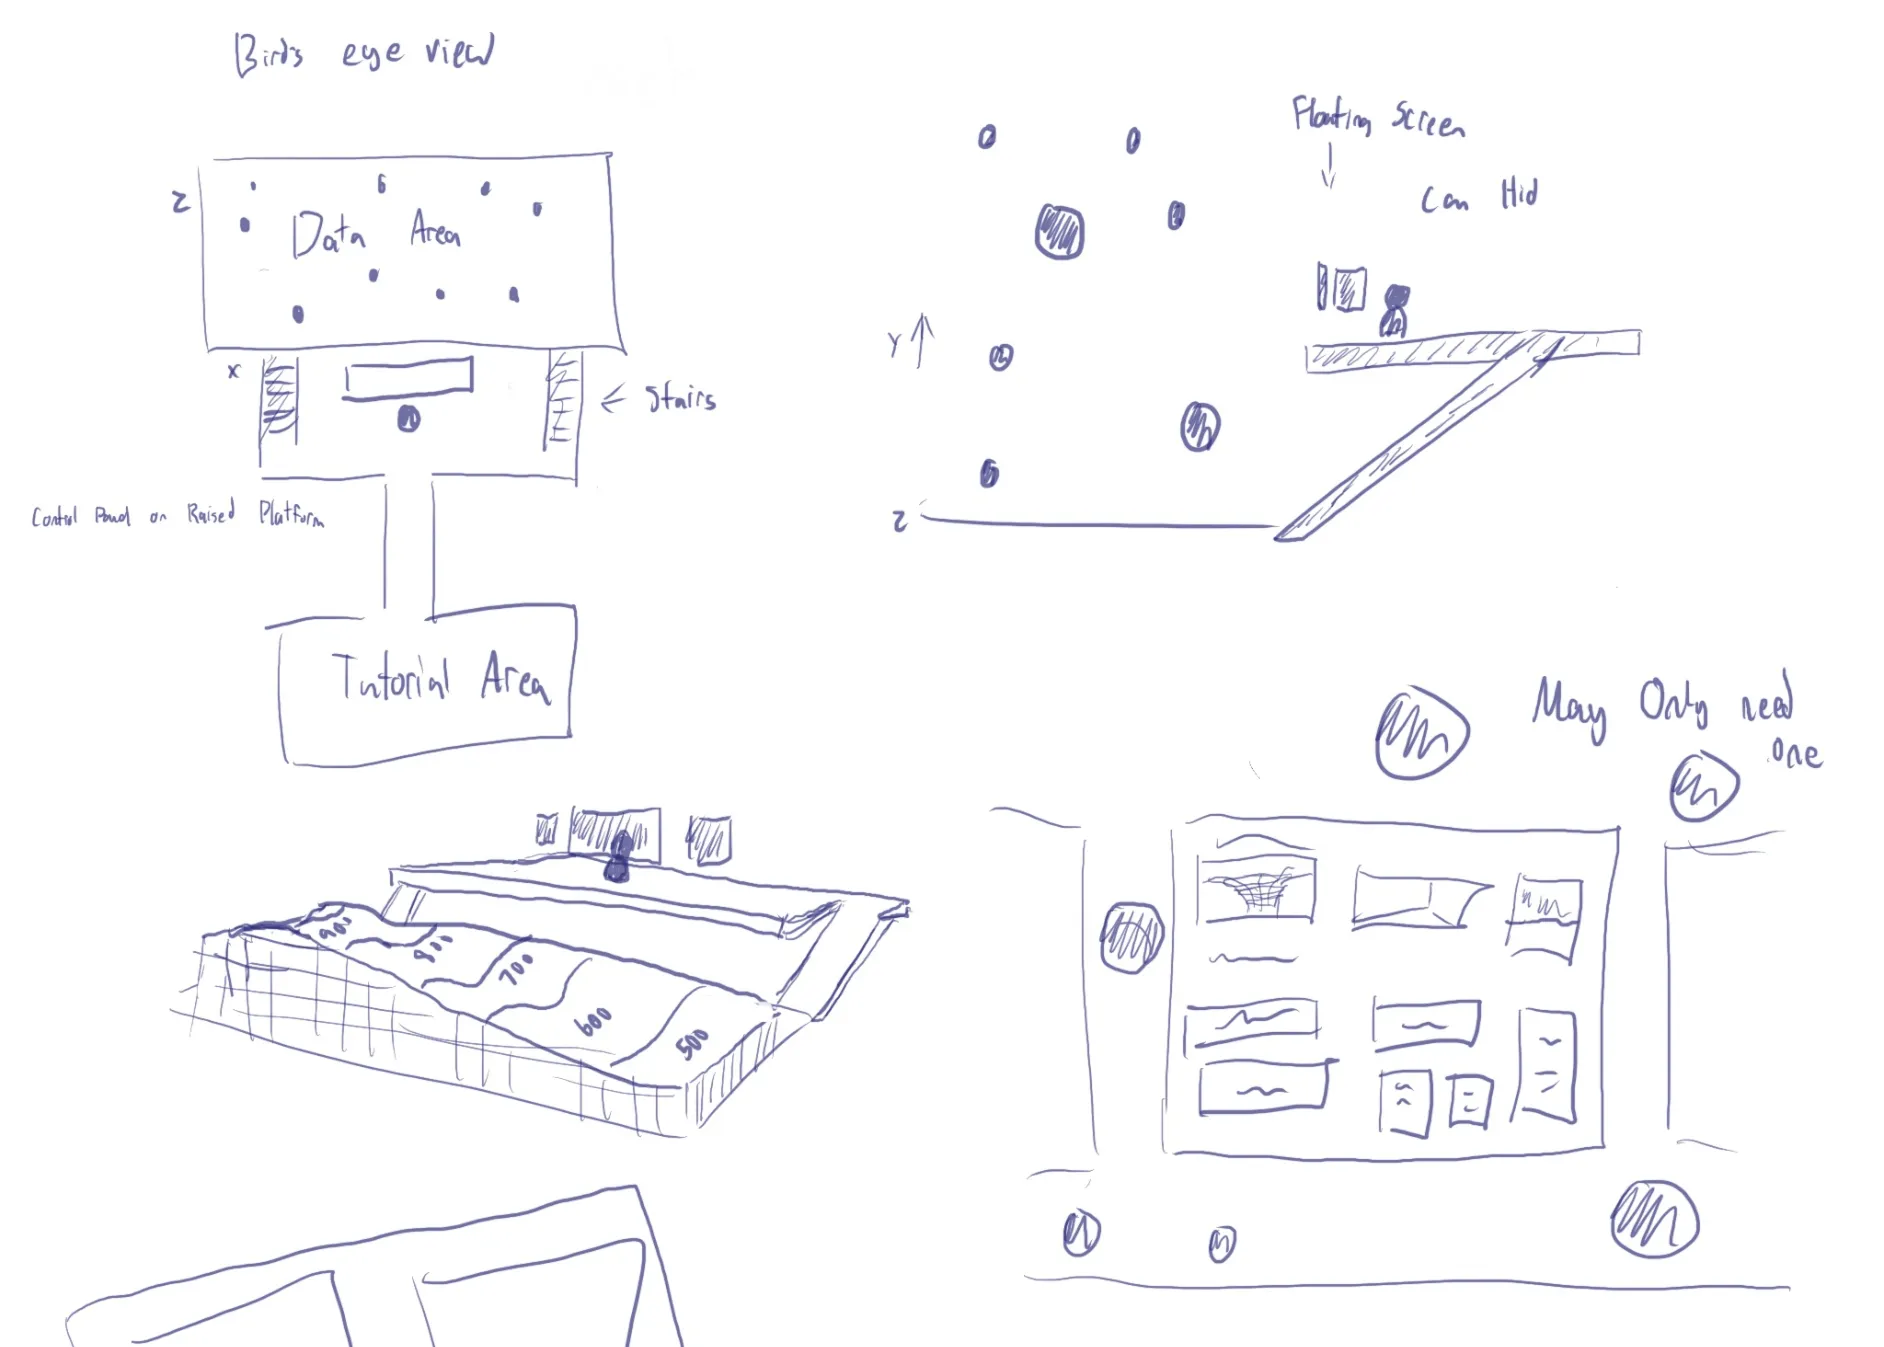
To bring our concept to life, we transformed our early design into a functional VR prototype using Unity and the ArcGIS Maps SDK. While my teammate focused on implementing locomotion, SDK integration and deployment, I also designed and implemented the interactive UI and interaction, ensuring a smooth and immersive user experience.
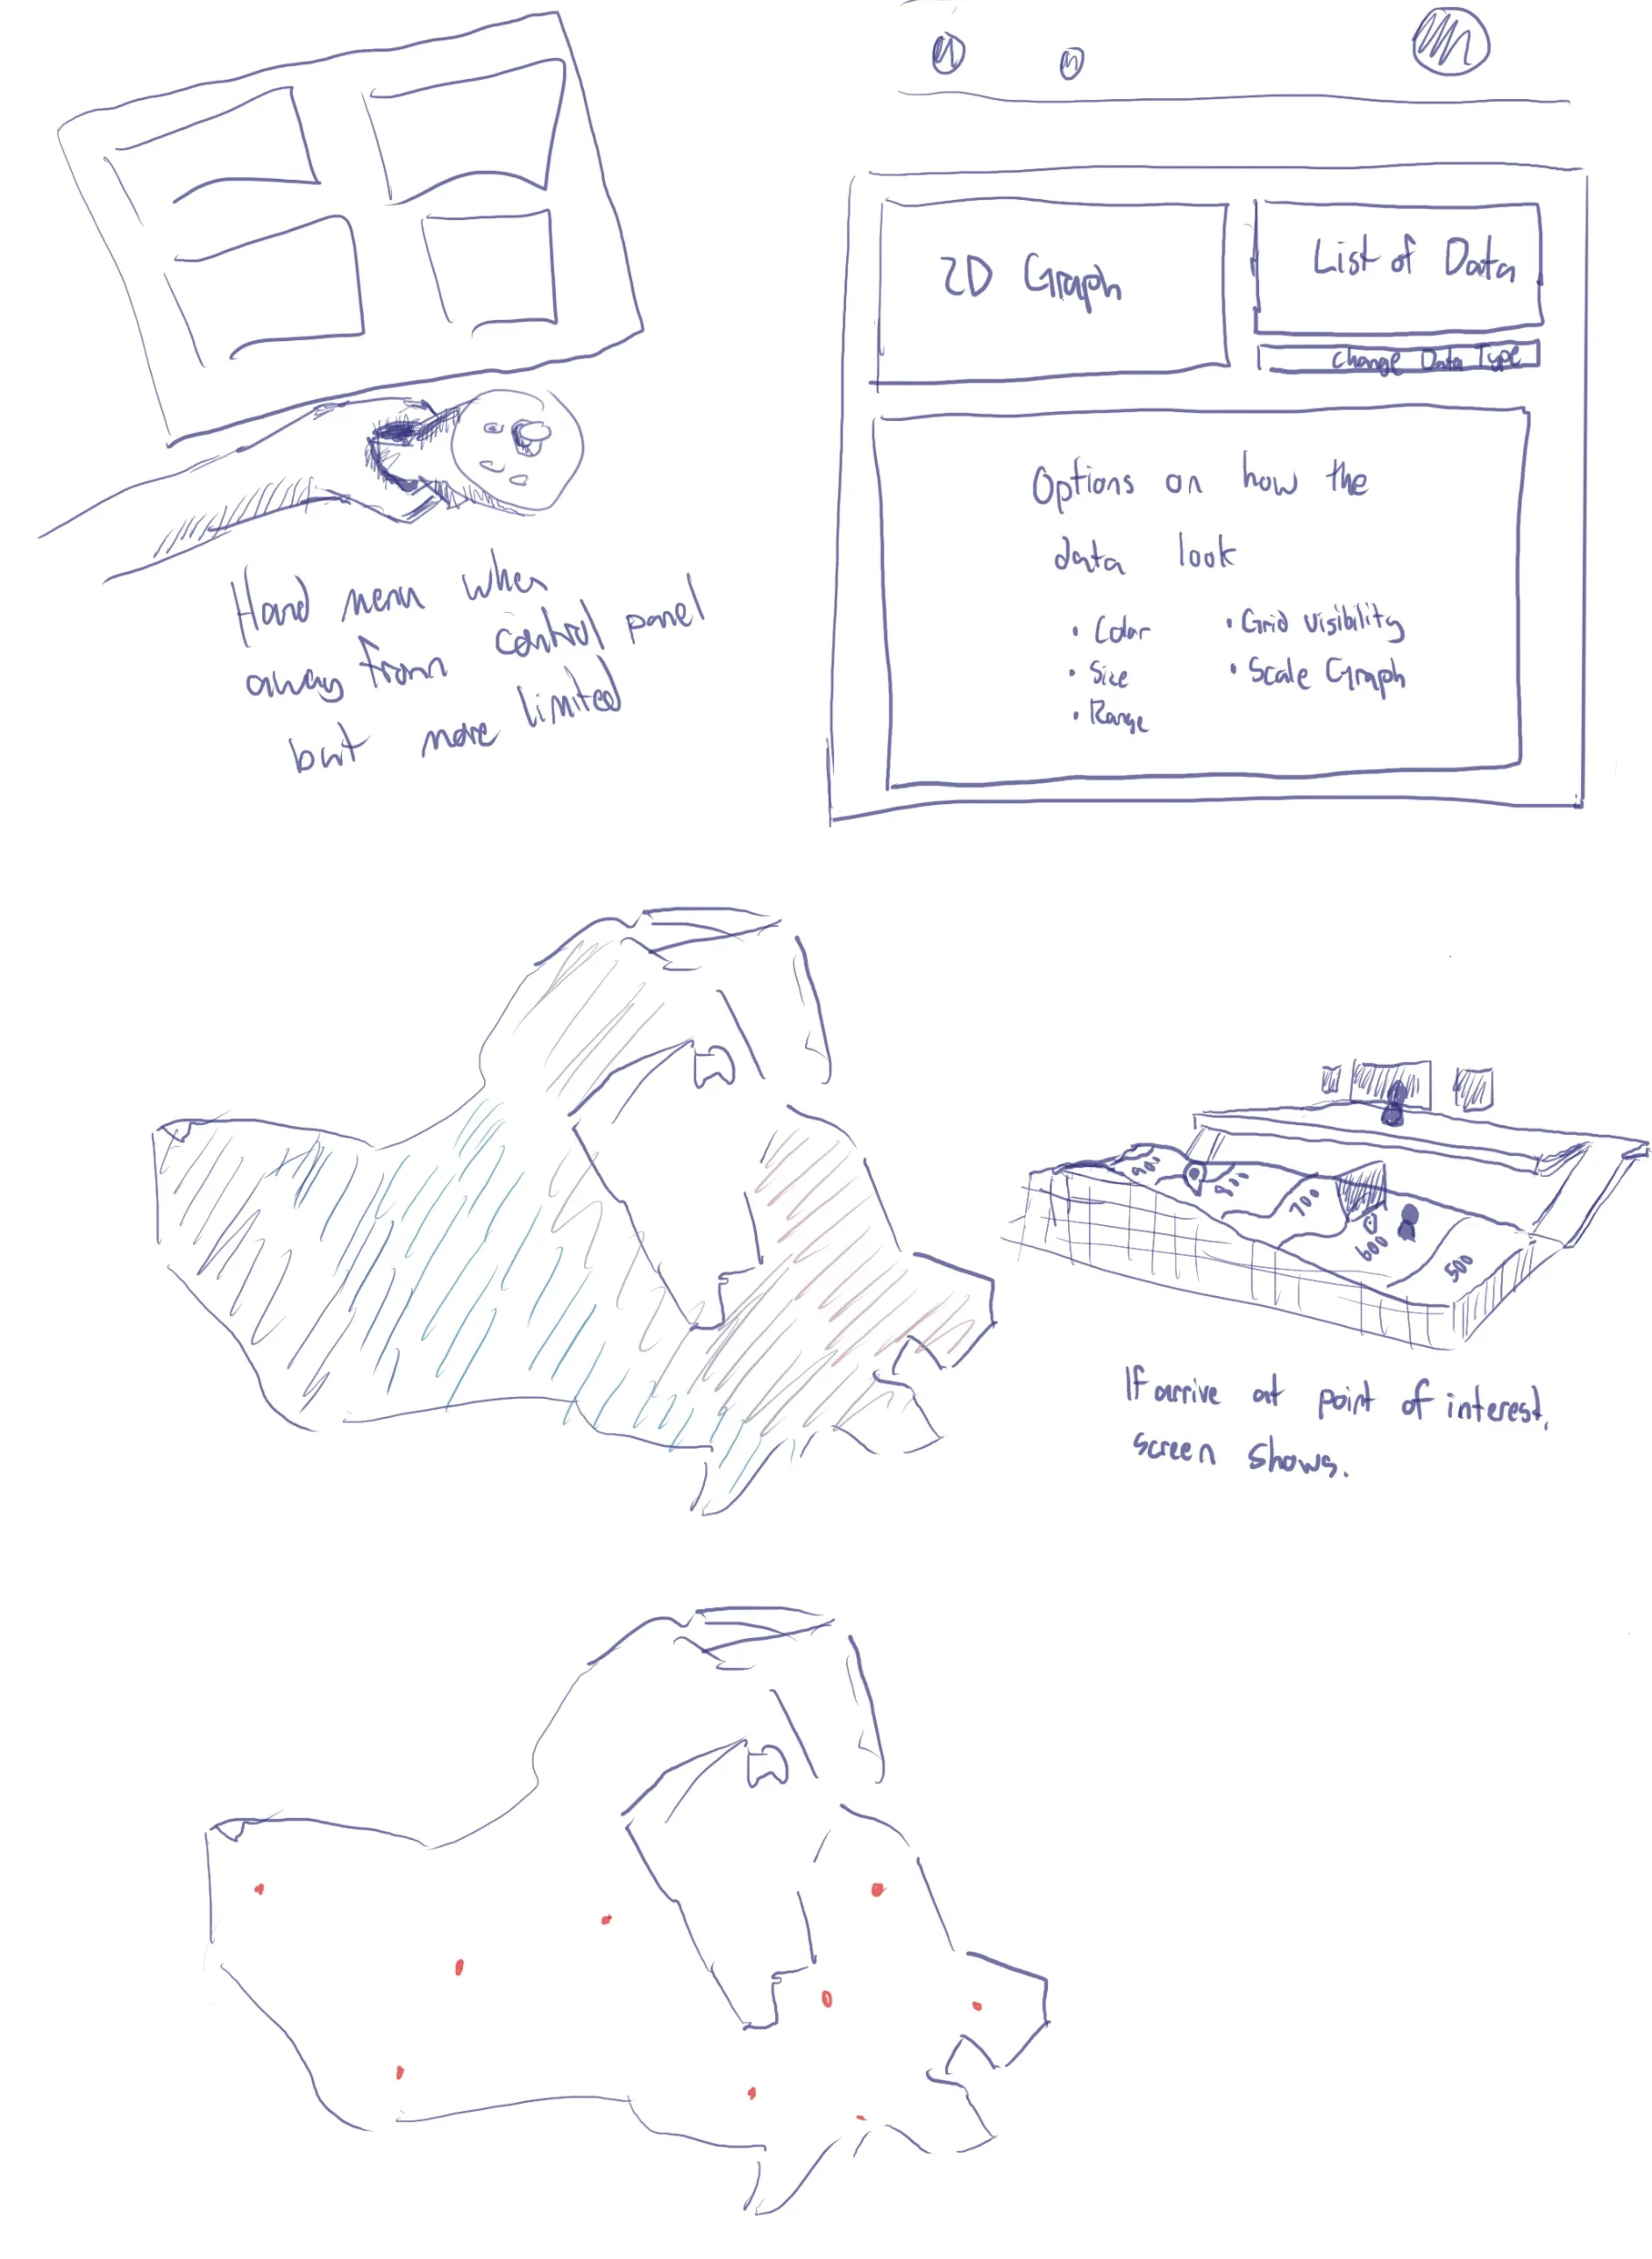
Interactive VR UI System
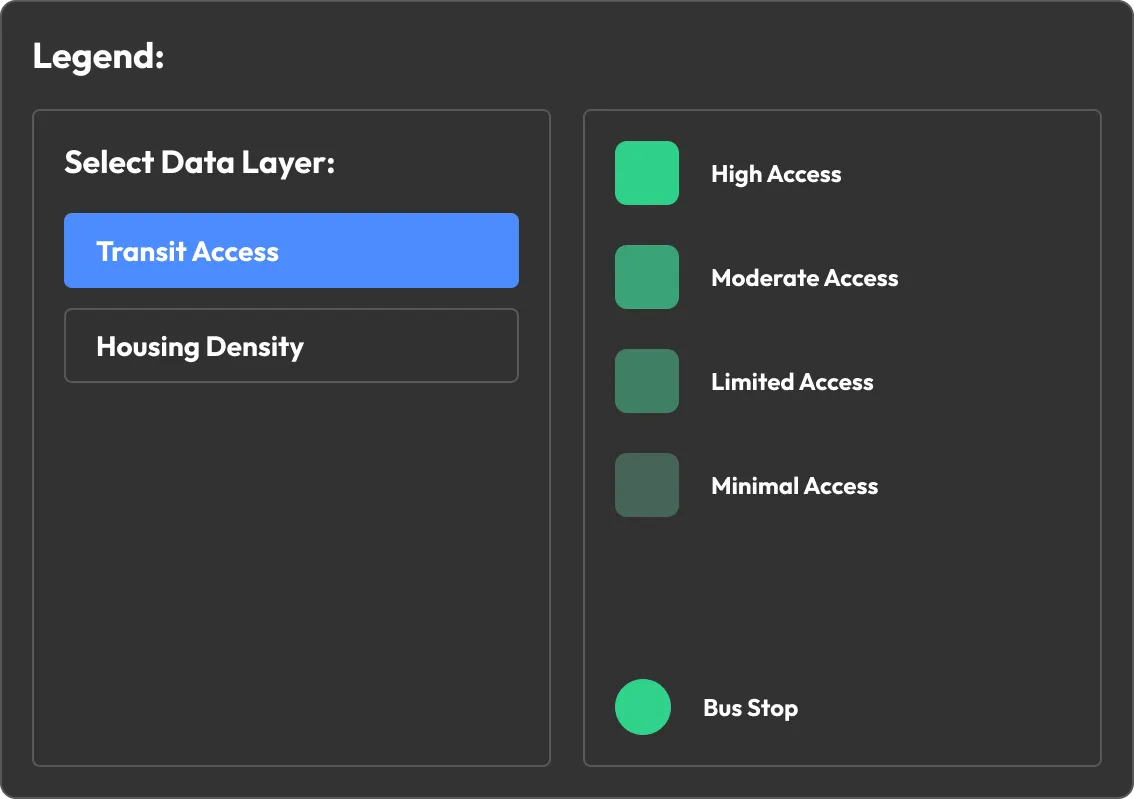
I implemented the user interface, including toggles for data layer visibility, opacity sliders, and a toggleable legend panel. These tools allowed users to explore and manipulate geospatial data in real time.
Interaction Scripting
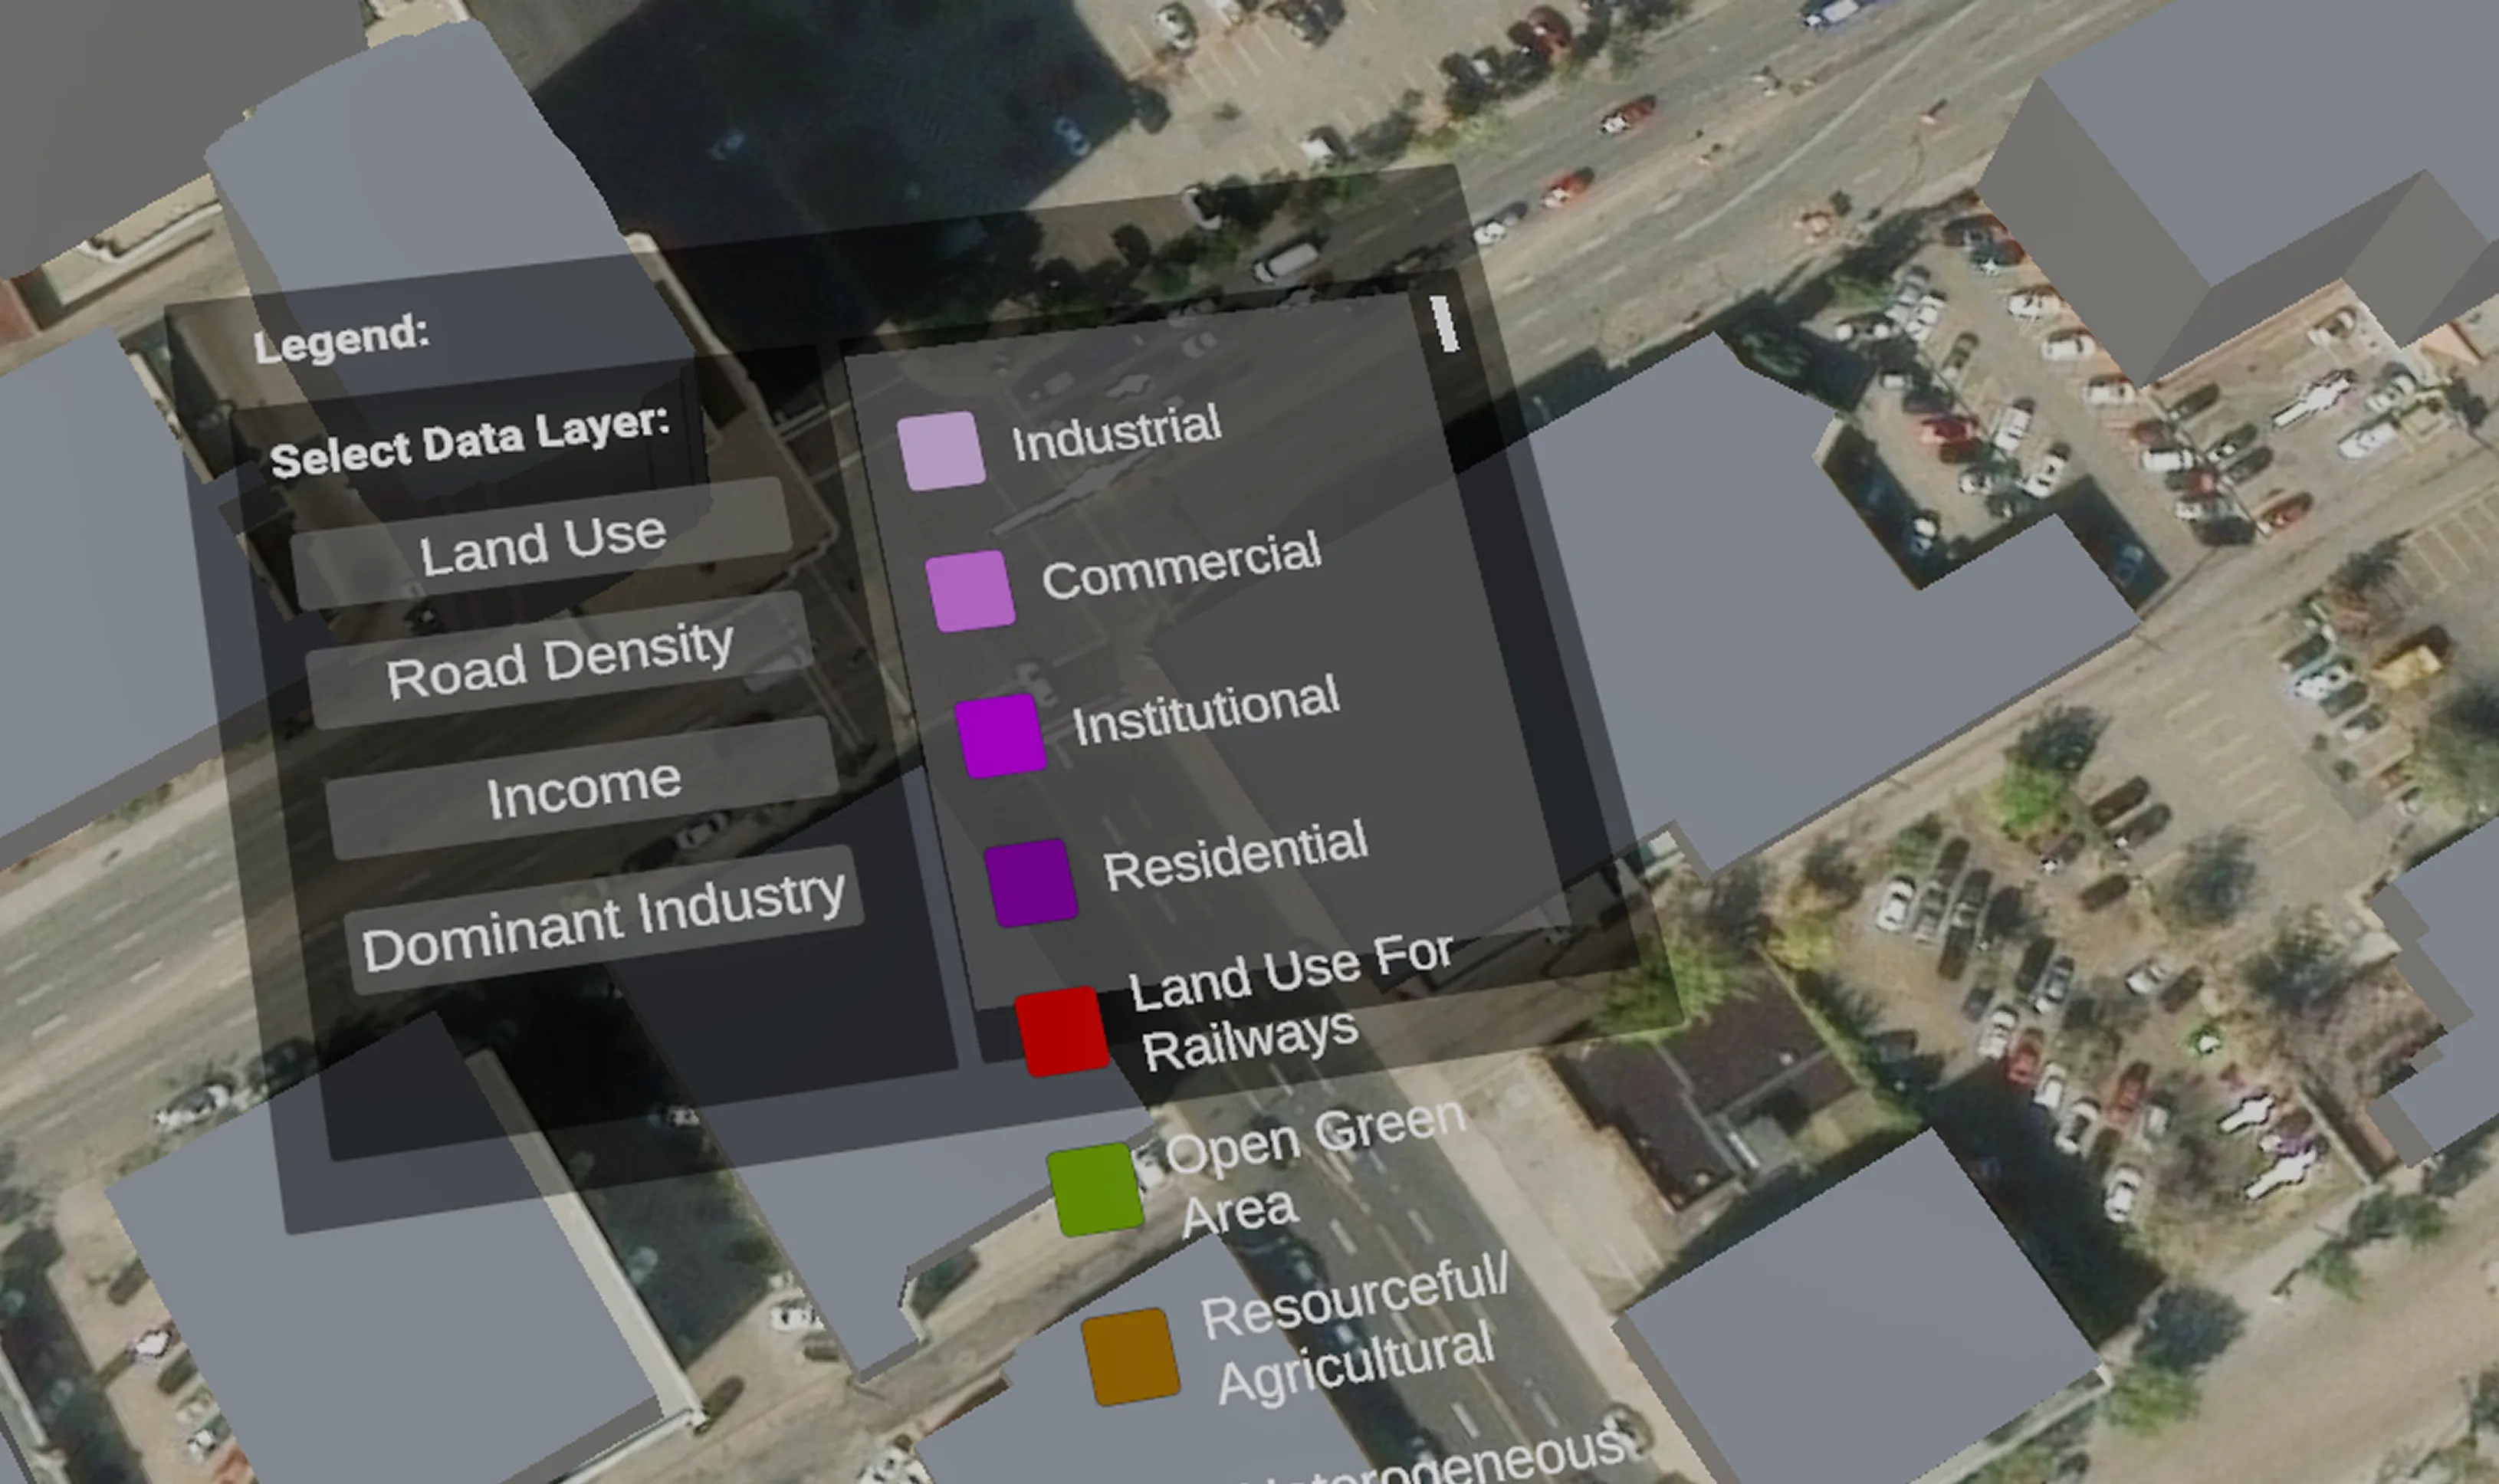
I contributed to scripting behaviours such as data layer switching and legend updates. I also played a role in adapting inherited code to fit our new data visualization goals.
Scene-Based Data Exploration
My teammate created the base environments using public datasets, while I ensured each city scene (Edmonton, Paris, Tokyo) supported seamless UI interaction and consistent user experience across locations.
ArcGIS Data Constraints
The free ArcGIS account limited us to using publicly available tile and scene layers. Attempts to upload and use custom datasets failed due to hosting restrictions. Solution: We adapted by sourcing quality public datasets, especially for cities like New York and Tokyo, for our prototype.
UI Scripting & Layer Control
Implementing runtime control of data layers via the UI required reverse-engineering some ArcGIS API code due to the lack of documentation. Solution: By analyzing the SDK scripts, we created custom functions to toggle visibility, adjust opacity, and switch data legends interactively.
Version Control Limitations
Unity's large file sizes quickly exceeded GitHub's storage limits, complicating collaboration. Solution: Our solution was to adopt Unity DevOps, which better handled the project's larger files and allowed smooth collaboration.
To evaluate the usability and effectiveness of our VR prototype, we designed and conducted a structured user testing session. We aimed to assess how easily participants could navigate and understand spatial data in VR and whether the interactive controls were intuitive for all users.
While we couldn't implement the changes from our testing, we got an insight into how we can improve both our design and development skills for VR. By embracing both the creative and practical challenges of VR development, we delivered a functional prototype that pushed our skills and demonstrated the viability of spatial data exploration in virtual environments.
Shifting focus early led to a stronger product direction
Pivoting from abstract datasets to geospatial data mid-project allowed us to ground the experience in real-world use cases and better align with user expectations for spatial understanding.
Working within technical constraints taught resourceful problem-solving
Limitations from the ArcGIS SDK, Unity version control, and VR build compatibility forced us to explore alternate tools and workflows, building our confidence in navigating platform-specific challenges.
Collaboration and clear task division accelerated progress
Splitting responsibilities between UI/UX design and development helped us iterate faster and maintain a steady development pace over the semester.

Timeline: Jan 2025 – Apr 2025
A redesign of Excel Society’s website focused on improving usability, accessibility, and improved staff content management.
Timeline: Sept 2024 – Dec 2024
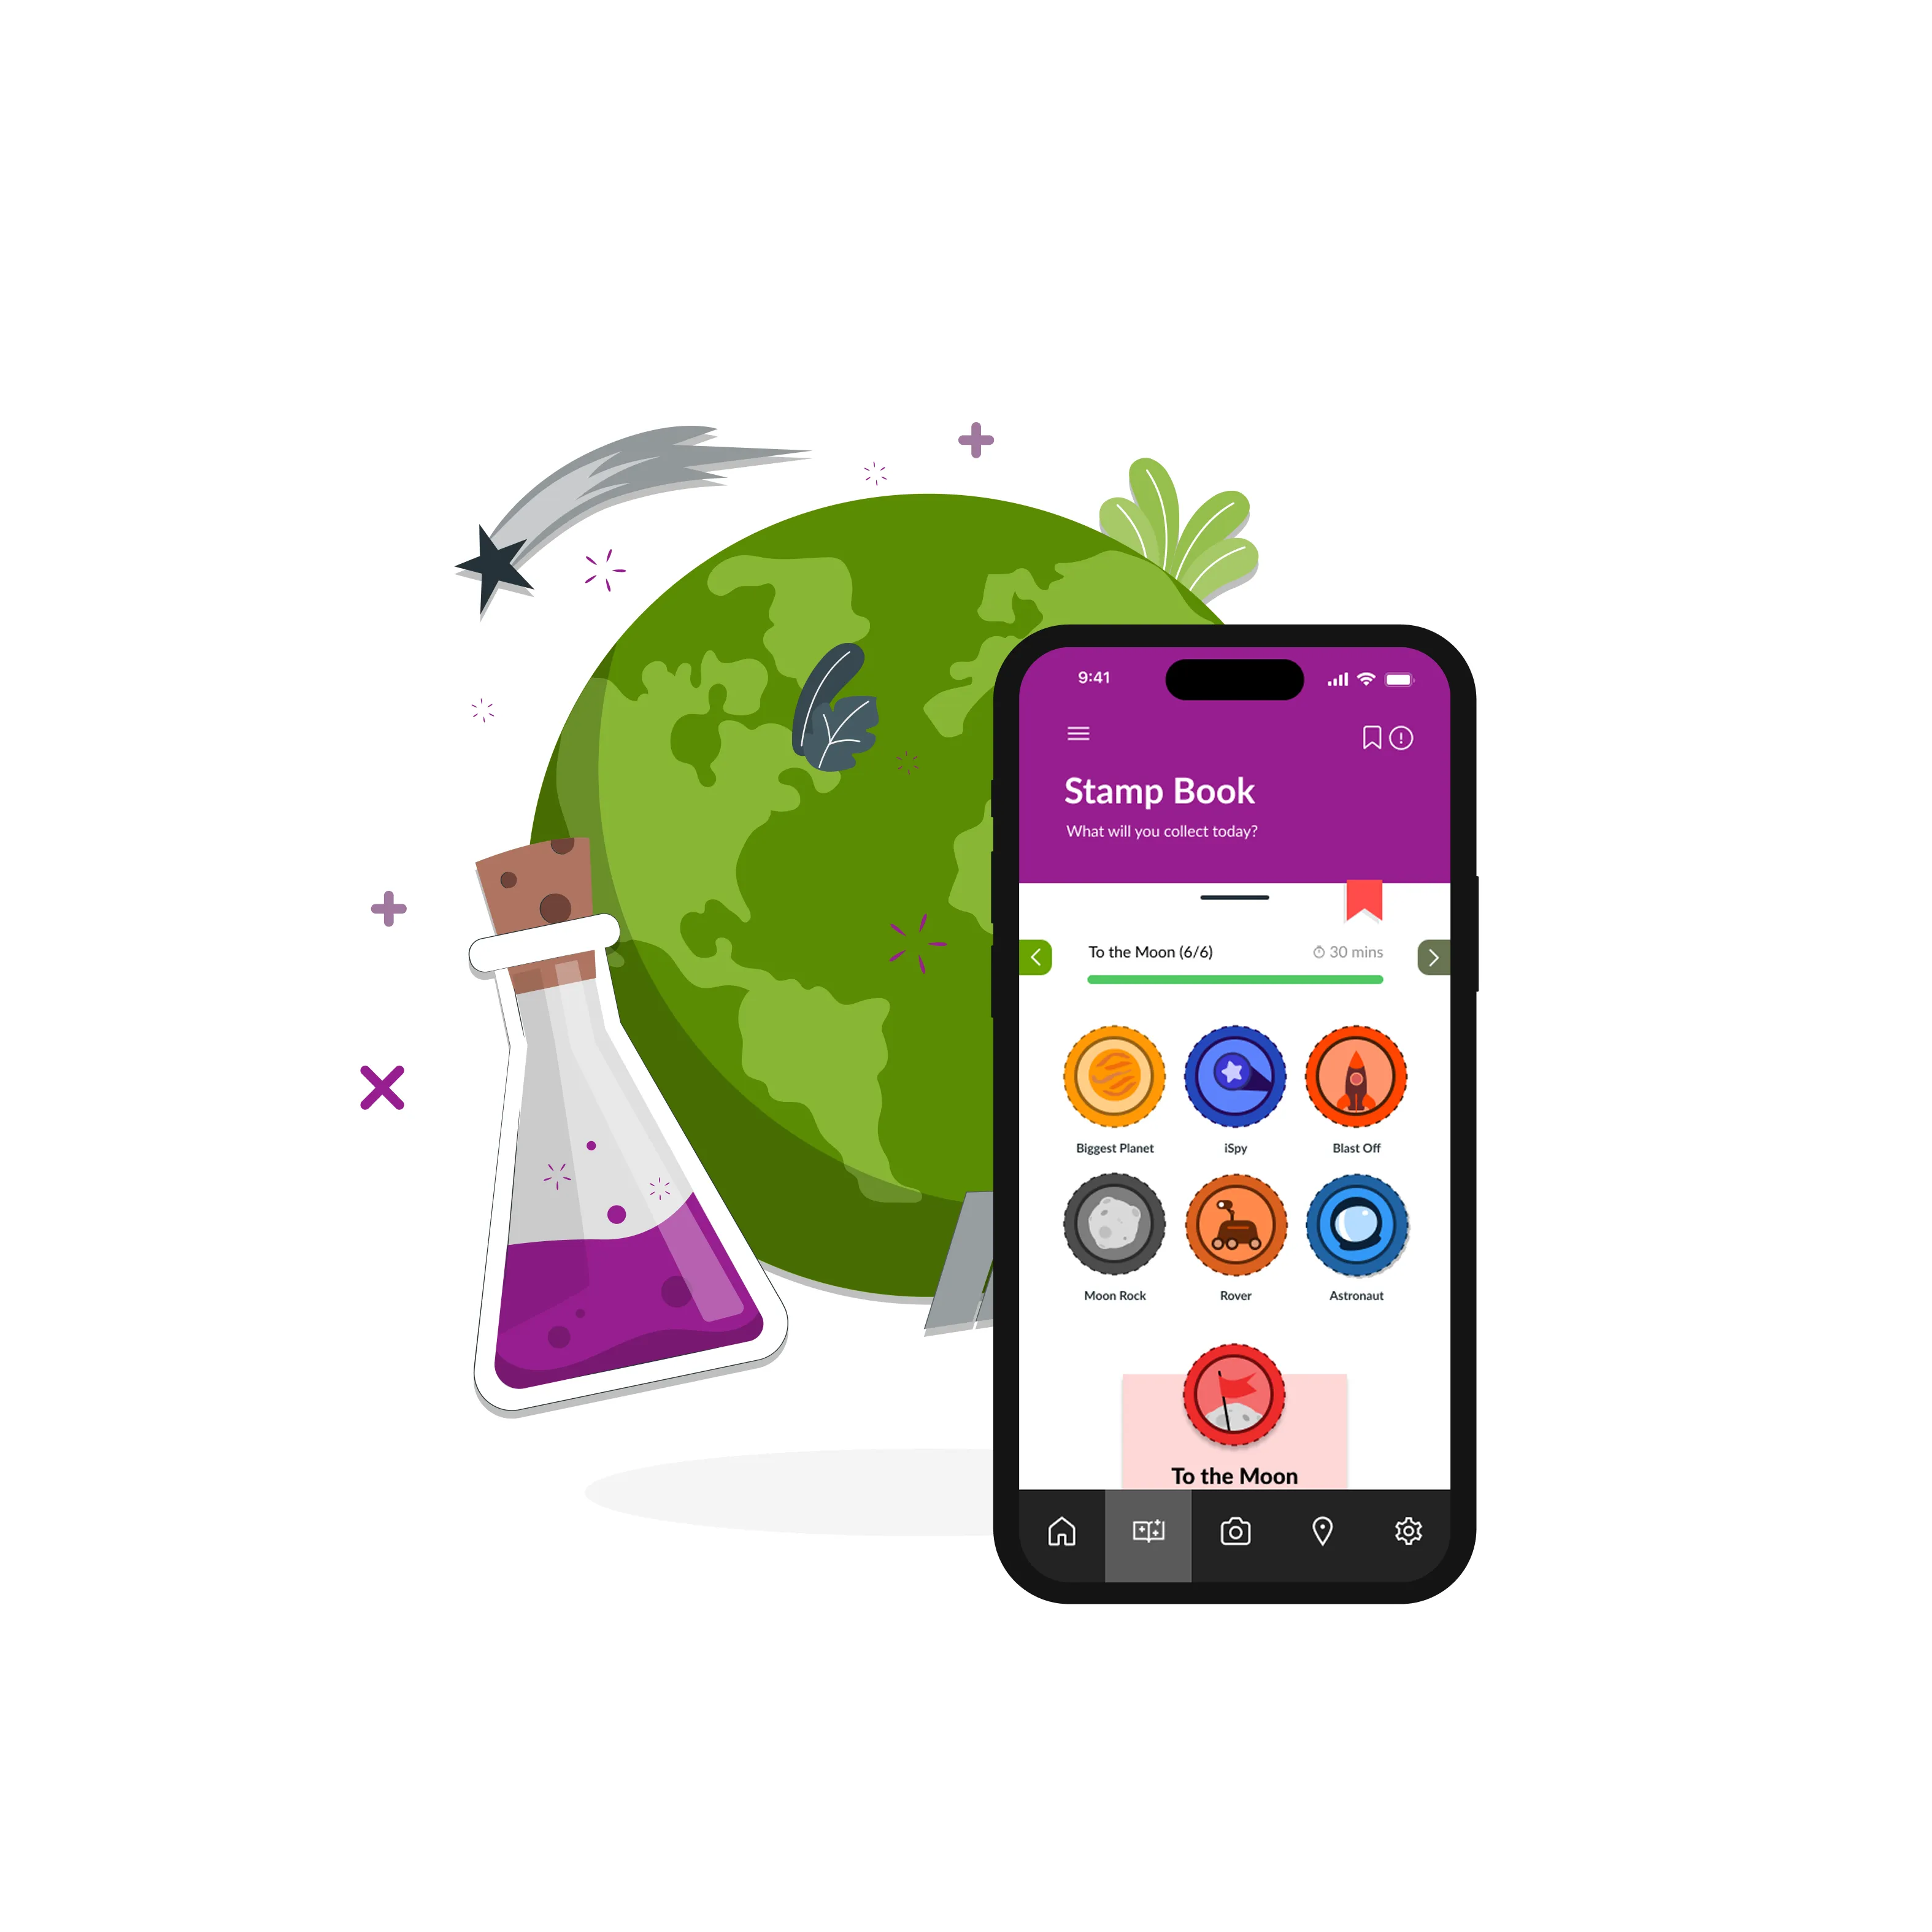
A mobile AR app created to enhance navigation, accessibility, and engagement for visitors at Telus World of Science Edmonton.